Who has discovered about stellar spectra?
The light pouring from distant stars, when meticulously captured and analyzed, provides a unique chemical and physical biography of its source. This captured light, once separated into its constituent colors to form a stellar spectrum, became the primary tool by which astronomers could begin to decipher the true nature of the universe beyond our solar system. The story of who discovered what about these spectra is not a tale of a single "Eureka!" moment, but rather a long, often painstaking process involving countless observations, revolutionary theoretical breakthroughs, and the persistent efforts of dedicated scientists, many of whom were initially relegated to clerical work. Early spectroscopy revealed that stars were not uniform, presenting patterns of dark or bright lines that hinted at the elements present within their atmospheres.
# Initial Observations
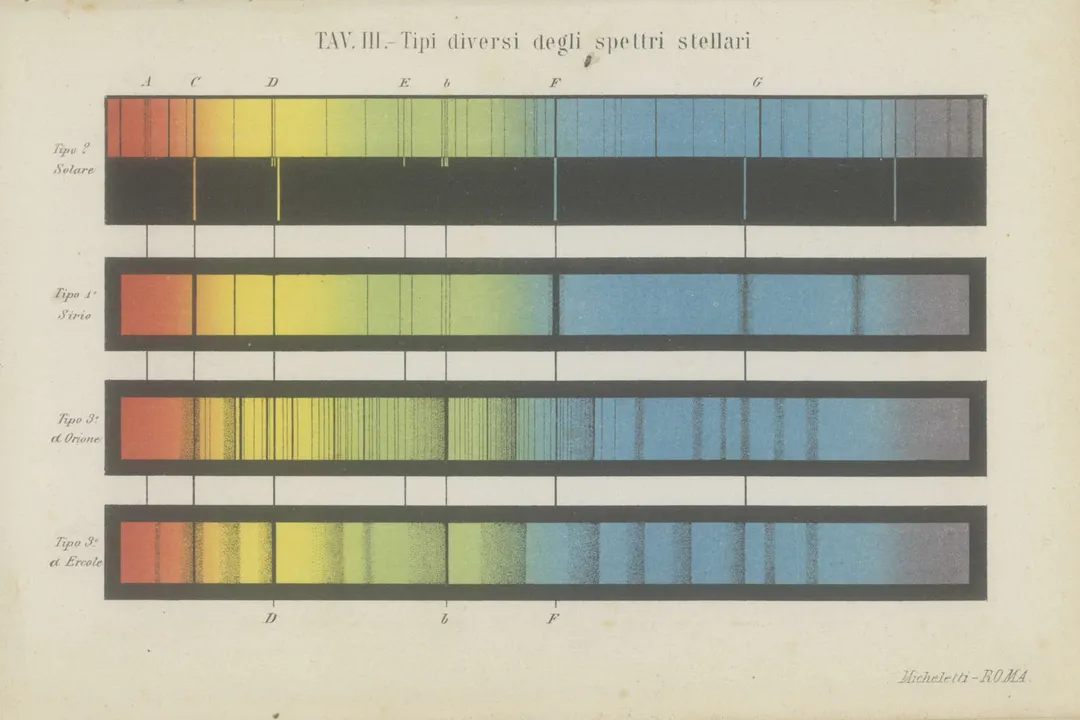
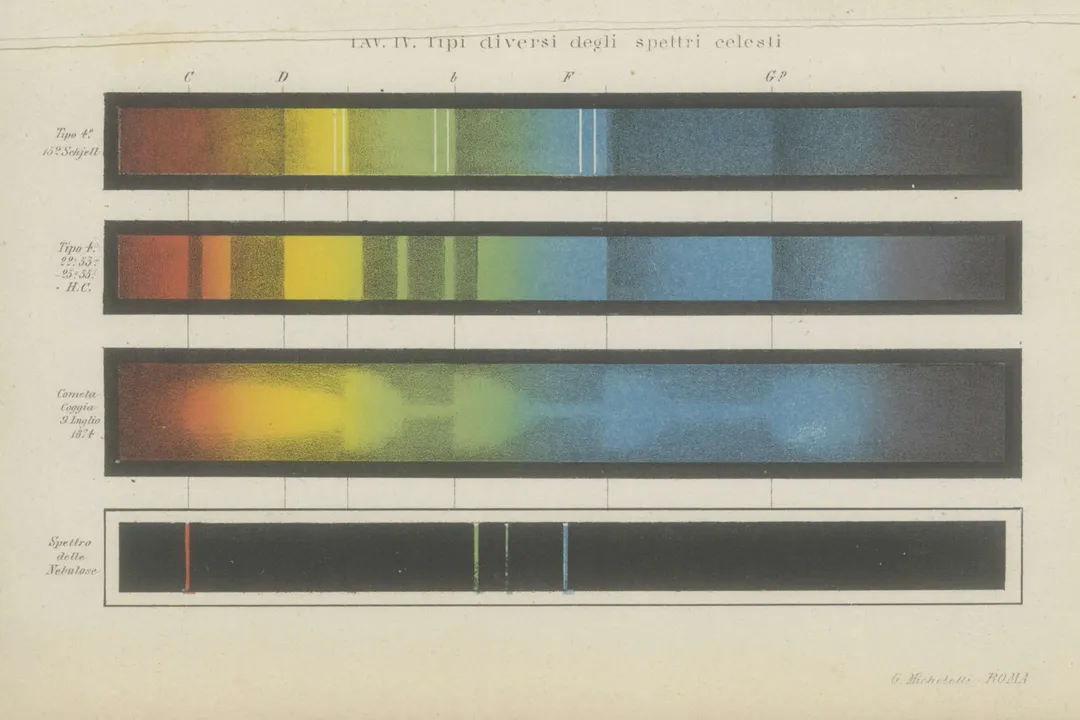
The history of spectroscopy in astronomy generally begins with the observation of spectral features in sunlight. While the initial groundwork involved mapping dark lines in the solar spectrum, an effort often attributed to Joseph von Fraunhofer in the early 19th century, the systematic application of this technique to all stars—to create a classification scheme—came much later. By the late 1800s, astronomers realized that the differences in the patterns and strengths of these absorption lines between various stars were systematic, suggesting a physical ordering principle existed. Telescopes were providing the raw data, but the interpretation required a new way of thinking about physics and stellar evolution.
# Harvard Computers
The critical first step in organizing the chaotic wealth of spectral data fell to a group of women working at the Harvard College Observatory under the direction of Edward Charles Pickering. These pioneering women, often referred to as the "Harvard Computers," were tasked with the immense labor of visually inspecting and cataloging thousands of stellar spectra photographically. They initially classified stars based purely on the appearance of the spectral lines, primarily the strength of the Balmer lines of hydrogen.
This initial classification used letters, which were assigned in an order that seemed somewhat arbitrary based on line strength: A, B, C, D, and so on, through O. Think of this as an enormous, human-powered data sorting project. The sheer scale of their undertaking is almost unimaginable today; one figure, Annie Jump Cannon, alone classified the spectra for over 359,000 stars, significantly streamlining the early system. Cannon, known for her speed and accuracy, was instrumental in revising the initial sequence based on these visual characteristics.
The sequence that gradually emerged from this tireless sorting was: A, B, F, G, K, M, with other letters interspersed for peculiar cases. At the time, however, the accepted wisdom—the prevailing theory—was that these spectral differences corresponded primarily to the chemical composition of the stars. Astronomers assumed that a star showing strong helium lines, for example, must contain vastly more helium than a star showing faint ones. This assumption, based on the observational data but lacking a physical basis, would soon be proven entirely incorrect.

# The Physical Enigma
The early classification system, although highly effective for cataloging, presented a profound mystery to astrophysicists: why did stars appear to be composed of wildly different primary elements? If all stars were fundamentally similar, why did some spectra look so radically different from others? The observational record suggested a dazzling variety of chemical abundances across the galaxy, which did not align with the growing understanding that the universe was composed of relatively few fundamental elements.
This confusion persisted because the connection between the observed line strength and the actual elemental abundance was not understood. The critical missing link was the understanding of how temperature governed the ionization state of atoms, which in turn dictated which spectral lines would be visible or suppressed.
# Payne's Revolution
The true discovery about stellar spectra—what they actually reveal—is inextricably linked to the work of Cecilia Payne. Working on her doctoral thesis at Radcliffe College, advised by Harlow Shapley, Payne took the Harvard spectral classifications and applied the developing theories of atomic physics, particularly those related to quantum mechanics.
In 1925, her thesis, Stellar Atmospheres: A Contribution to the Observational Study of High Temperature in the Reversing Layers of Stars, provided the bombshell discovery. Payne demonstrated, using detailed calculations, that the differences in the observed spectra were overwhelmingly due to temperature, not composition. The pattern the Harvard Computers had observed—the sequence of A, F, G, K, M—was, in physical reality, a temperature sequence.
Payne's most startling conclusion, derived from her physical model, was that the atmospheres of stars were composed almost entirely of hydrogen and helium, with all other heavier elements present only in trace amounts. This finding directly contradicted the contemporary belief that the elements found on Earth were representative of the cosmos.
The initial resistance to Payne’s conclusion, despite the impeccable physics underpinning it, highlights the difficulty in overthrowing an established paradigm, even when the evidence is clearly presented. It took several years for the astronomical community to fully accept that a star’s spectral appearance was a thermometer first and a compositional readout second.
# Reordering the Sequence
Once the temperature dependence was understood, the spectral sequence was reordered to reflect a physically meaningful progression, moving from the hottest stars to the coolest. Payne’s work provided the physical justification for reordering the visually derived letters: the modern sequence is O, B, A, F, G, K, M.
| Spectral Class | Approximate Temperature (K) | Key Feature Example | Color |
|---|---|---|---|
| O | > 30,000 | Ionized Helium (He II) | Blue |
| B | 10,000 – 30,000 | Neutral Helium (He I), strong Hydrogen | Blue-White |
| A | 7,500 – 10,000 | Strongest Hydrogen lines | White |
| F | 6,000 – 7,500 | Metals (e.g., ionized Calcium) increasing | Yellow-White |
| G | 5,200 – 6,000 | Strong neutral metal lines (like our Sun) | Yellow |
| K | 3,700 – 5,200 | Strong molecular lines appearing | Orange |
| M | < 3,700 | Titanium Oxide () bands | Red |
This OBAFGKM sequence, which is still the standard framework used today, directly maps the appearance of thousands of spectral lines to a single physical variable—surface temperature. This realization, stemming from Payne's theoretical work, transformed stellar spectroscopy from mere taxonomy into genuine astrophysics. The structure of this classification is so efficient that even minor deviations from the main sequence, such as the addition of L, T, and Y classes for cooler objects, often just indicate the need to adjust for pressure or metallicity, rather than a complete overhaul of the temperature scale.
# Spectra Physics
The discovery of who figured out stellar spectra is incomplete without acknowledging the fundamental physics that underpins the line patterns themselves. The dark lines, known as absorption lines, arise when light from the star's deep, hot interior passes through the cooler, less dense gas in the outer atmosphere. Atoms in that atmosphere absorb photons at specific wavelengths corresponding to the energy required to move an electron to a higher orbital state.
What Payne proved was that while the elements were the same (mostly H and He), the state of those elements varied drastically with temperature. A very hot O-type star has so much energy that the hydrogen atoms are almost completely ionized (losing their electrons), meaning they cannot produce the visible Balmer absorption lines, resulting in relatively weak hydrogen features. Conversely, an A-type star is at the perfect temperature to have a significant fraction of its hydrogen atoms in the exact state required to produce the strongest, most visible Balmer lines. A cooler G-type star, like the Sun, is too cool for much hydrogen excitation, but hot enough to excite the atoms of heavier metals like calcium and iron, whose lines dominate its spectrum. Analyzing these subtle differences allowed for detailed modeling of stellar atmospheres, leading to publications like the 1950 discussion on spectral analysis that built upon this foundational understanding.
If one were to simply compare the spectral lines of a G2V star (like our Sun) and an M0V star, the untrained eye might conclude the M star is rich in titanium and lacks hydrogen, based only on line strength. The deeper discovery, achieved by Payne, was realizing that both stars are overwhelmingly hydrogen-based, but the M star’s low temperature has allowed complex molecules to form, suppressing the typical high-temperature atomic lines. This insight provided a unified physical theory for spectral variations that the previous compositional-based theories could not.

# The Continuing Legacy
The work done by the Harvard Computers and Cecilia Payne laid the bedrock for modern astrophysics. Their methods demonstrated the power of large-scale, systematic data collection coupled with rigorous physical theory. While later astronomers, using techniques like Doppler broadening and high-resolution spectroscopy, have added layers of detail—examining line shapes to determine stellar rotation, turbulence, and even magnetic fields—the primary classification framework remains fundamentally the same OBAFGKM sequence established by their efforts.
For instance, subsequent researchers built upon Payne’s work by refining the classification to account for surface gravity, leading to the Yerkes system which adds luminosity classes (e.g., main sequence V, giant III) to the temperature-based spectral type. This shows the continuous evolution: first, classifying by appearance (Harvard), then by temperature (Payne), and finally by density/size.
The discovery about stellar spectra was not just about identifying elements; it was about uncovering the underlying physics governing the stars themselves. It revealed that stars are dynamically linked through temperature, following a predictable life cycle where the spectral type changes over billions of years—a direct consequence of the thermonuclear reactions deep in their cores. The initial cataloging by the computers and the profound physical interpretation by Payne ensured that studying a star's faint, colored light remains the single most productive way to understand stellar evolution, distance, and age across the entire universe. The work effectively turned astronomy into a quantitative physical science based on light analysis.
#Videos
Stellar Spectroscopy - Women in Astrophysics - YouTube
#Citations
originally, the stellar spectra were arranged - Essay
Lecture 9: Stellar Spectra
Stellar classification - Wikipedia
Fr. Secchi and stellar spectra - NASA ADS
Cecilia Payne: Discoverer of the Chemical Makeup of Stars | AMNH
On a physical theory of stellar spectra - The Royal Society
Stellar Classification - Joachim Weise
Development of Stellar Spectroscopy - SpringerLink
Stellar Spectroscopy - Women in Astrophysics - YouTube