What are the relationships between stars shown in the H-R diagram?

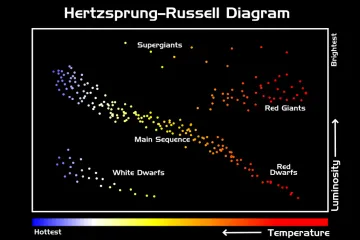
The Hertzsprung-Russell (H-R) diagram offers astronomers a statistical snapshot of stellar populations, mapping fundamental physical characteristics against each other to reveal deep relationships between stars across their lifecycles. [1][3][5] It is fundamentally a scatter plot, not a map showing where stars physically reside in space, but rather where they fall based on their measured luminosity (or absolute magnitude) and surface temperature (or spectral class). [1][7] Understanding the structure of this diagram is key to understanding stellar evolution, as different regions correspond to different dominant physical processes occurring within the star. [4]
# Axes Defined

The vertical axis of the H-R diagram generally represents a star's intrinsic brightness, often expressed as Luminosity relative to the Sun, or more commonly, its Absolute Magnitude. [2][3] Brighter stars occupy the top of the diagram, while dimmer stars are found toward the bottom. [7]
The horizontal axis represents the star's Surface Temperature, which is inversely related to the spectral classification. [2][7] Oddly, temperature decreases from left to right on the standard plot. [5] The hottest stars, typically blue or blue-white, are on the far left, corresponding to spectral types O and B. [2][7] Moving right, the stars cool down, transitioning through types A, F, G (like our Sun), K, and finally ending on the far right with the coolest, dimmest stars, which are often red M-type stars. [2][7] This inverse plotting of temperature is a historical convention that remains standard in modern representations. [5]
# Main Sequence Positions
The most striking feature of the H-R diagram is the prominent diagonal band running from the upper-left to the lower-right, known as the Main Sequence. [1][3] Stars on the Main Sequence are currently fusing hydrogen into helium in their cores, representing the longest and most stable phase of stellar life. [3][4]
The primary relationship governing a star's location on the Main Sequence is its initial mass. [4][7] This relationship is steep and direct:
- High Mass Stars: The most massive stars burn through their fuel rapidly. They are extremely hot and highly luminous, placing them at the upper-left end of the Main Sequence (O and B spectral types). [7]
- Intermediate Mass Stars: Stars similar to the Sun occupy the middle section (G and K types). [2]
- Low Mass Stars: The least massive stars burn their fuel slowly, resulting in lower surface temperatures and dim luminosity, positioning them at the lower-right of the band (M type). [2][7]
This grouping reveals a fundamental constraint: for a star in its hydrogen-burning phase, its temperature and luminosity are almost entirely predetermined by how much material it started with. [4] The Main Sequence is not merely a line but a representation of time; a star spends roughly 90% of its active existence in this stable equilibrium, meaning that the sheer density of observed points in this region reflects the long duration of this phase compared to the short, dramatic periods spent in the giant or dwarf phases. [4]
# Giant Branches
Stars move off the Main Sequence when they exhaust the hydrogen fuel in their cores, marking the beginning of their post-main sequence evolution. [7] This transition creates distinct clusters of stars in other parts of the diagram where their relationships between size, temperature, and output change dramatically. [4]
Stars that have evolved off the Main Sequence often become Red Giants or Supergiants. [1] These stars are characterized by being very luminous—sometimes thousands of times brighter than the Sun—yet their surface temperatures are relatively cool, placing them in the upper-right section of the diagram. [3][4] This apparent contradiction (high luminosity despite low temperature) is resolved by considering the star's physical size. [4] To achieve such high brightness with cooler surface temperatures, these stars must possess an enormous surface area, which is dictated by the expansion of their outer layers after core hydrogen burning ceases. [5] A Red Giant, for example, is structurally very different from a Main Sequence star of comparable mass, illustrating how the same stellar mass can manifest completely different relationships between temperature and luminosity depending on its evolutionary stage. [4]
# White Dwarf Region
At the opposite extreme of size and evolution are the White Dwarfs. [1] These stellar remnants are found clustered in the lower-left portion of the H-R diagram. [3] The relationship defining this region is one of extreme density and small physical size. [7]
White Dwarfs are typically the leftover cores of low- to intermediate-mass stars, like the Sun, after they have shed their outer envelopes. [4] They are extremely hot, meaning they plot on the left side of the diagram, but their luminosity is very low because they are roughly the size of Earth. [4][7] Their very small surface area drastically reduces their total energy output, despite their high temperature. This juxtaposition of high temperature and low luminosity perfectly demonstrates how surface area acts as a powerful multiplier (or divider) in determining total energy radiated, a relationship summarized by the Stefan-Boltzmann law linking Luminosity, Radius, and Temperature. [5]
# Stellar Movement
The H-R diagram also maps the temporal relationships between stellar properties. A star does not remain fixed in one spot for its entire existence; instead, it follows a path known as an evolutionary track. [7]
For a star like the Sun, its track involves:
- A relatively brief period ascending the Main Sequence as it settles into core hydrogen burning. [4]
- A rapid move up and to the right off the Main Sequence as it swells into a Red Giant. [7]
- A subsequent contraction and heating phase, often leading to the Horizontal Branch or Asymptotic Giant Branch, depending on the star's mass. [4]
- Finally, a movement down and to the left as the star shrinks into a small, hot White Dwarf, where it slowly cools over billions of years. [1][4]
Examining a collection of stars on an H-R diagram, such as those within a globular cluster where all stars formed at roughly the same time, allows astronomers to see the simultaneous existence of different evolutionary stages. [3] The "turn-off point" on the Main Sequence for that cluster tells us the mass of the stars that are currently exhausting their hydrogen, which in turn sets the age of the entire group. [7] This concept—where the diagram serves as a clock for stellar populations—is one of its most powerful applications, showing the chronological relationship between stars born together. [3]
Because the diagram plots intrinsic properties that are linked by the laws of physics (mass, radius, temperature, and fusion rate), the resulting structure is not random. [5] It is the expected consequence of stellar birth, life, and death governed by gravity and nuclear physics. This structure allows us to deduce that stars of similar initial composition, but vastly different masses, will follow predictable, non-intersecting evolutionary pathways across the diagram, resulting in the clearly defined regions we observe. [4] When observing any random sample of stars, the distribution on the diagram—the specific arrangement of points in the MS, giants, and dwarfs—is a direct consequence of how long stars spend in each phase, making it a physical constraint rather than an arbitrary grouping. [4]
#Videos
HR Diagram Explained - Star Color, Temperature and Luminosity
Related Questions
#Citations
Hertzsprung–Russell diagram - Wikipedia
Pre-lab 9: Stars and the HR Diagram - MTSU Physics
The H–R Diagram | Astronomy - Lumen Learning
Introduction to the HR Diagram - Chandra X-ray Observatory
[PDF] Hertzsprung–Russell diagram - Wikipedia, the free encyclopedia
HR Diagram Explained - Star Color, Temperature and Luminosity
The Hertzsprung-Russell Diagram - NAAP - UNL Astronomy
Hertzsprung-Russell diagram | Research Starters - EBSCO
Hertzsprung-Russell Diagram - University of Oregon