What color of star has the lowest surface temperature?
The star boasting the lowest surface temperature is red. This might seem counterintuitive to someone whose only experience of "cool" colors is blue or green, but in the realm of celestial objects, color is a direct indicator of the heat radiating from a star's visible surface. [1][4] When we look up at the night sky, the subtle tints we might perceive, or the vibrant colors captured by advanced telescopes, tell a story about whether a star is burning intensely or merely glowing faintly.
# The Temperature Spectrum

The connection between a star's color and its surface temperature is one of the fundamental principles of stellar astrophysics, rooted in how objects emit light based on their heat. [1] This relationship is described by physical laws—like Wien's law—which state that as an object gets hotter, the peak wavelength of its electromagnetic radiation shifts toward the bluer, shorter end of the spectrum. [1]
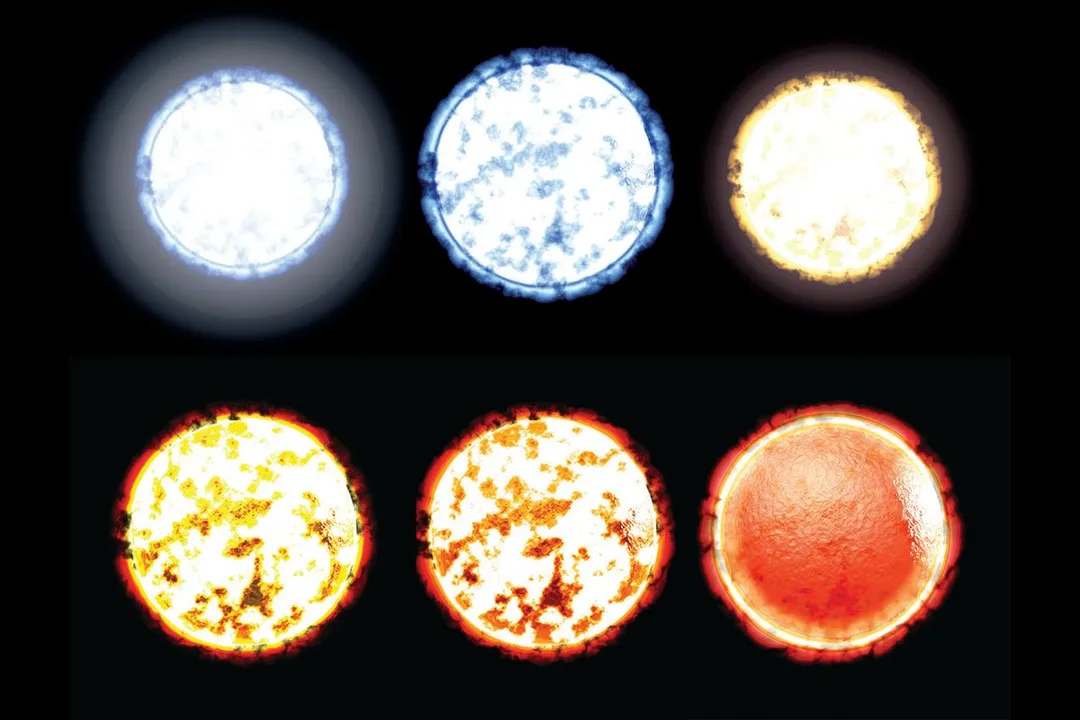
Conversely, when an object cools down, its peak light emission shifts toward the longer, redder end of the spectrum. [1] A very hot star radiates energy across the entire spectrum, but its light output is dominated by blue and ultraviolet wavelengths, making it appear blue or blue-white. [1][3] At the opposite end, the coolest stars emit the bulk of their visible light energy at longer, red wavelengths, with much of their radiation actually falling into the invisible infrared region. [1]
# The Coolest Hues
The coolest stars we observe are definitively red, representing the lowest rung on the stellar temperature ladder. [3][4] These stars generally fall into the Class M category of the Morgan-Keenan (MK) spectral classification system. [3] While many sources cite a figure around as the typical surface temperature for a red star, more detailed classifications suggest a slightly broader range for these cooler members of the main sequence. [3][4] Specifically, the surface temperature for these coolest red stars can span from approximately 2,400 K up to 3,700 K. [3]
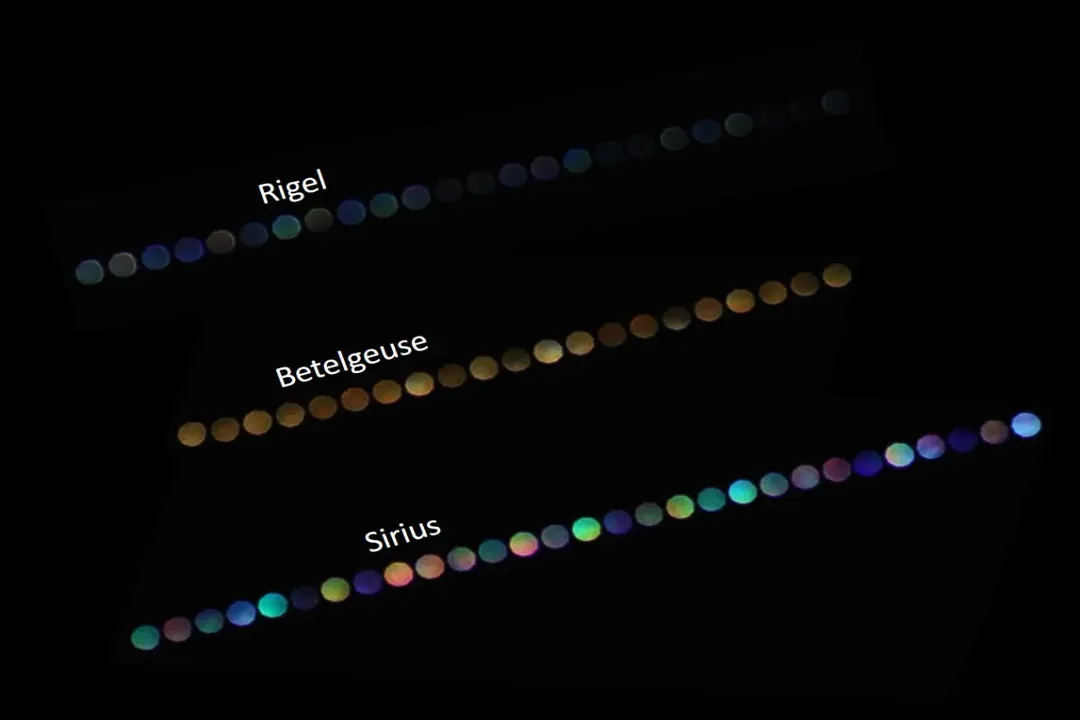
To put this into perspective, these cool, dim embers are dramatically cooler than our own Sun, which sits near the middle of the temperature scale. [1] Stars like Betelgeuse, often cited as a prime example of a cool red giant, showcase this characteristic warmth, contrasting sharply with the fiery blue-white giants like Rigel. [3][4]
# Color Benchmarks
To make the study of star color more systematic than simple visual assessment, astronomers quantify color using brightness measurements taken through specific filters, yielding a color index (like ). [1] The resulting temperature scale reveals a significant gap between the coolest and hottest visible stars.
Here is a comparison of representative colors, their approximate temperatures, and their spectral classes, illustrating the dramatic range across the cosmos:
| Star Color | Approximate Temperature (K) | Spectral Class | Example Star |
|---|---|---|---|
| Blue | $25,000$ to $30,000+$ | O | Rigel |
| White | A | Vega | |
| Yellow | G (Sun-like) | The Sun | |
| Orange | K | Aldebaran | |
| Red | $2,400$ to $3,700$ | M | Betelgeuse |
What is fascinating when looking at this scale is how close the temperature range of the very coolest stars ( K) is to the theoretical temperature limit for a true star, which is roughly $2,000$ K. [1] Below this threshold, an object may be classified as a brown dwarf rather than a true star, as it lacks the internal heat to sustain hydrogen fusion, yet its surface temperature would still place it at the extreme reddish end of the color spectrum if it were luminous enough to be distinctly seen. [1]
# Stellar Classification
The classification system that maps these colors—the Morgan-Keenan (MK) system—was built upon earlier work by Annie Jump Cannon, which primarily ordered stars by their observed color. [3] The modern system uses letters to denote temperature bands: O, B, A, F, G, K, and M, ordered from hottest to coolest. [3]
Class O stars are the blazing blue giants, clocking in at over . [3] As you move down the sequence, the temperature drops steadily: Class B is bluish, A is blue-white, F is white, G is yellow-white (where our Sun resides), K is orange, and finally, M is reserved for the coolest red stars. [3] The systematic nature of this ordering means that a lower temperature directly correlates with a lower place in the alphabetical sequence. [3]
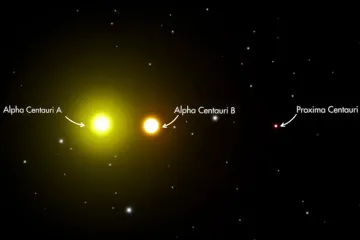
An interesting consequence of this temperature gradient is its relationship with the star's physical attributes. For stars on the main sequence, which are actively fusing hydrogen, a lower surface temperature (like that of an M-class red star) is associated with a smaller mass and lower overall luminosity compared to a massive, hot blue star. [3] The massive O-class star might be to times the mass of the Sun and times as luminous, whereas a small red dwarf (M-class) might only be to solar masses and significantly less luminous. [3]
# Observing True Color
While the physics dictates that the coolest stars are red, what we see when we look at the sky is often less clear. This discrepancy highlights the difference between a star's intrinsic color and its apparent color as viewed from Earth. [1]
One significant factor is the sensitivity of the human eye. Our eyes have two types of light-sensitive cells: rods, which register intensity, and cones, which perceive color. [4] Because stars are overwhelmingly faint point sources of light, our cones often fail to activate, causing most stars to appear white to the naked eye, regardless of their actual hue. [4] Only the brightest stars possess enough light intensity to engage the cones, allowing us to detect the subtle blues, yellows, or reds. [4]
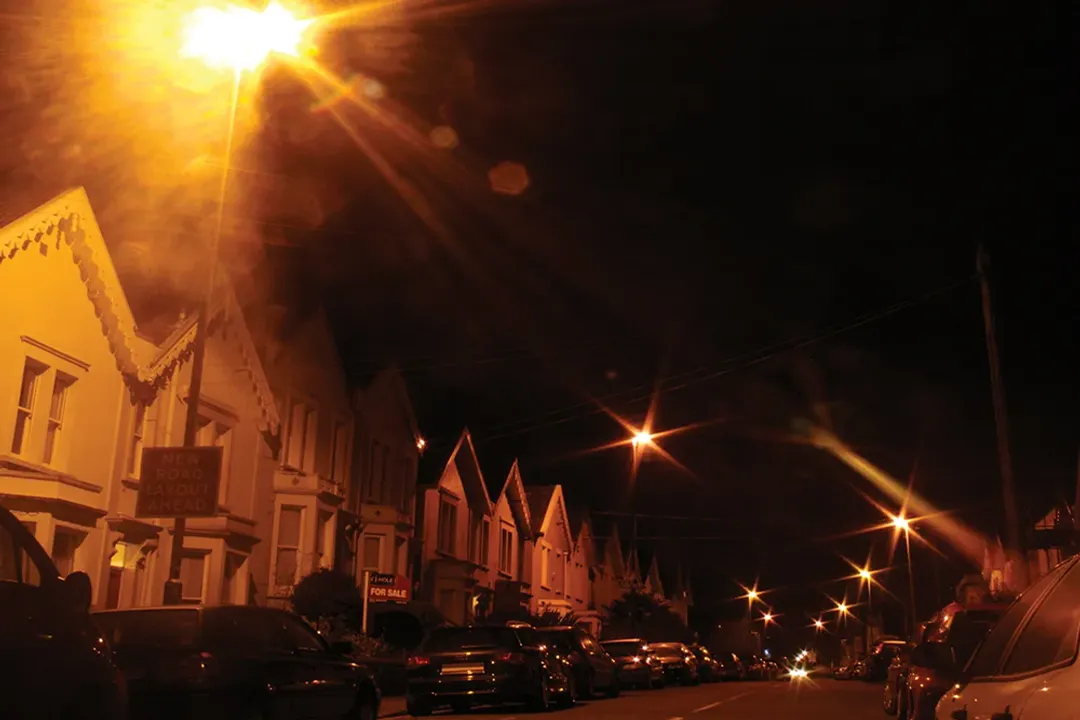
Furthermore, the Earth’s atmosphere interferes with the light reaching us. As starlight travels through the atmosphere, molecules scatter the shorter (bluer) wavelengths more effectively than the longer (redder) wavelengths—a process called extinction or interstellar reddening. [3] This scattering effect can make a star appear slightly redder than it truly is. [3] For example, when observing the Sun near the horizon, this exaggerated scattering causes it to appear orange or red, even though from space, it appears white because its light output is relatively even across the spectrum. [3]
It's also worth noting what colors are missing. Stars produce light based on a black-body spectrum determined by temperature, which means they do not emit all the colors of the rainbow. [3] There are no truly green stars because any star whose peak emission falls in the green part of the spectrum (like our Sun at ) also emits significant amounts of blue and red light, causing the eye to perceive the combined color, which is closer to white or yellow-white. [3]
# Mass and Luminosity Link
Understanding the coolest stars brings us to a key point about stellar evolution and classification: temperature, mass, and luminosity are intimately linked, especially for main-sequence stars. [3] The very act of having a low surface temperature (being red) implies that the star is less massive and therefore generates less energy per second—it has lower luminosity—than its hotter, bluer counterparts. [3] This relationship is neatly mapped out on an Hertzsprung-Russell (HR) diagram, where temperature and luminosity correlate along the main diagonal band, running from high temperature/high luminosity in the upper left corner down to low temperature/low luminosity in the lower right. [3] A star’s surface color, therefore, is not just a feature of its light output; it serves as a quick proxy for its internal furnace settings, its mass, and its overall lifespan on the main sequence.
Related Questions
#Citations
The Colors of the Stars From Hottest to Coldest - Science Notes
Colors of Stars | Astronomy - Lumen Learning
Star colours explained for beginners | BBC Sky at Night Magazine
Classifying Stars By Colour: Hertzsprung-Russell Diagram