What causes statistical outliers?

Data points that sit far away from the main cluster of observations are often flagged as statistical outliers, but simply identifying them is only the first step. Understanding why they appeared in the dataset is what truly informs robust analysis and trustworthy conclusions. [1][2] These anomalies aren't always mistakes; they represent a complex intersection of human action, mechanical limitations, and the inherent randomness of the universe we attempt to measure. [5] When we investigate the causes of these statistical deviations, we find that they generally fall into a few distinct categories, ranging from simple data entry slips to genuine, rare phenomena that defy expectation. [1]
# Observation Deviation

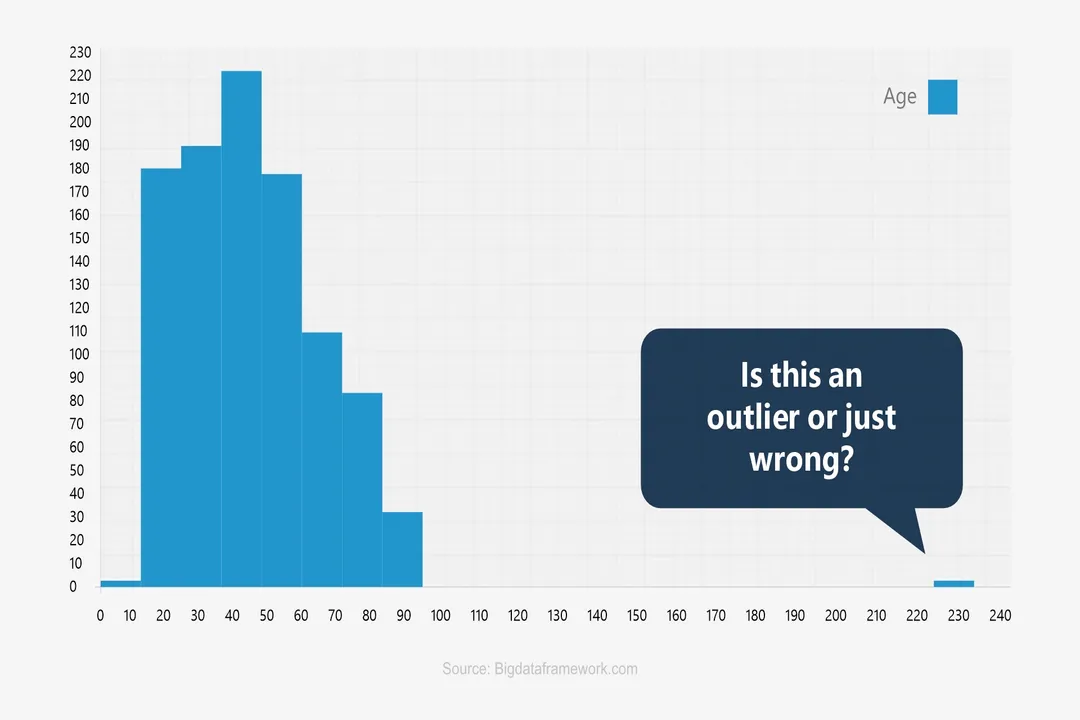
A statistical outlier is fundamentally a data point that deviates significantly from other observations in a sample or data set. [2] This deviation is what triggers the alarm bells for analysts, as these points can disproportionately influence descriptive statistics. For instance, a single, extremely high value can drastically pull up the sample mean, making the average unrepresentative of the typical observation, while simultaneously inflating the standard deviation. [3][6] This sensitivity is why outlier detection is considered a crucial preliminary step for building dependable models. [3] However, the definition of "significant deviation" is often relative, depending on the distribution and the analytical goal. [6] In a perfectly normal distribution, an observation many standard deviations away from the mean is suspect, but in skewed data, rules based on the Interquartile Range (IQR) might be more appropriate for initial flagging. [4]
# Manual Mistakes
The most common and often simplest cause of an outlier traces directly back to human interaction with the data collection or recording process. [1] These errors can occur at several stages, starting from the moment a measurement is taken or a response is gathered.
# Data Entry
When data is manually transcribed from a physical form or an instrument reading into a digital system, transposition errors are frequent culprits. Imagine recording a blood pressure reading of mmHg, but accidentally typing it as or perhaps entering $18$ instead of $81$ for a weight measurement. These slips are rarely intentional misrepresentations; they are usually momentary lapses in concentration. [1][5] If a researcher is processing hundreds of records, the cognitive load makes such errors almost inevitable without rigorous validation checks built into the data input process. [5]
# Collection Errors
Beyond simple typing, errors can creep in during the actual measurement phase. This might involve using the wrong unit of measure—perhaps recording a measurement in millimeters when the standard for the rest of the set is in meters—or a researcher simply recording a value incorrectly off a scale. [1] In laboratory settings, for example, an analyst might accidentally record the result from the previous sample's printout instead of the current one. [8]
# Survey Responses
When dealing with survey data, human factors introduce other types of anomalies. A respondent might rush through a long questionnaire, leading to "satisficing," where they choose the first plausible answer rather than the true one. [9] Other outliers in surveys can stem from simple inattentiveness, a misunderstanding of a complex question, or deliberately providing nonsensical answers to see how the survey proceeds. [9]
As an analyst facing a data set where the mean is suspiciously high, it’s worthwhile to check the raw data entry for simple transposition errors before moving to more complex explanations. If you see a value of
9999in a field expected to contain values between1and100, you are almost certainly looking at a placeholder for a missing value or a major data entry catastrophe, not a genuine measurement. [5]

# Process Failures

While human errors are often isolated incidents, process failures represent systemic issues within the equipment, environment, or standardized procedures used to generate the data. [5] These cause clusters of anomalous readings rather than just single, random points.
# Instrument Malfunction
Scientific instruments, sensors, and recording devices are fallible. An outlier might be the first sign that a piece of equipment is beginning to fail or is improperly calibrated. [8] In a chemical lab, for instance, a spectrophotometer that hasn't been zeroed correctly will produce results consistently shifted across all subsequent readings, potentially creating a distinct group of biased data points. [8] If a temperature probe is intermittently failing, it might report room temperature during a critical heating cycle, creating an artificially low outlier for that specific trial. [5]
# Contamination and Sampling Bias
The integrity of the sample itself is paramount. In laboratory analysis, contamination of a sample or reagent can lead to wildly inaccurate results. [8] Similarly, in field research, if the sampling method suddenly changes—perhaps a new technician starts collecting soil samples from a different depth than prescribed by the Standard Operating Procedure (SOP)—the subsequent data will deviate systematically. [8] This bias isn't a random error; it’s an error introduced by failing to adhere strictly to the established data generation protocol. [5]
For instance, imagine tracking package delivery times. If 99% of packages are delivered via standard ground shipping (average 3 days), but a handful of packages were sent via overnight air due to a VIP customer request, those overnight packages would be genuine, process-driven outliers (average 1 day). They are technically correct measurements, but they originate from a different operational process than the majority of the data set. [5]
# Natural Variation
Not every outlier requires correction or removal. Sometimes, the data perfectly reflects reality, and that reality includes extreme occurrences. [1][5] These are often referred to as true outliers, representing rare but valid phenomena within the population being studied. [1]
For example, when measuring the reaction time of thousands of individuals, the vast majority might fall between $150$ and $300$ milliseconds. However, one individual might have an exceptional neurological condition or be under the influence of a substance that causes their reaction time to be $900$ milliseconds. Removing that data point based solely on its statistical distance would result in a mean reaction time that underestimates the true variability in the human population. [5]
The challenge here is differentiation: how does an analyst distinguish between an error caused by a faulty machine and a genuine, albeit rare, event? This requires domain expertise. If you are measuring the height of adult men, a measurement of $8$ feet is statistically impossible due to biological constraints, suggesting an error. [1] If you are measuring the height of trees in an old-growth forest, a measurement of $250$ feet might be perfectly valid for a single, exceptionally old specimen. [1] The context dictates the plausibility of the extreme value.
# Domain Specificity
The root cause analysis often depends heavily on the field where the data was generated. What constitutes a likely error source shifts significantly between a controlled industrial environment and a behavioral science study. [8][9]
In controlled environments, such as analytical chemistry or manufacturing quality control, the focus for outlier causation tends to lean toward instrument calibration, reagent purity, and environmental fluctuations (like humidity or temperature affecting sensors). [8] The emphasis here is on maintaining strict SOPs, as deviations from those established procedures are primary sources of systematic error. [8]
Conversely, in social science or market research, the primary causes often revolve around respondent behavior. [9] A question about annual income might generate an outlier either from a billionaire (genuine extreme wealth) or from someone who misread the question and entered their age instead of their income (data entry/misunderstanding error). [9] Without established physical constraints like those in chemistry, the analyst must rely more heavily on cognitive models of respondent behavior to hypothesize the cause.
# Investigative Steps
When an outlier surfaces, the immediate impulse might be to apply a standard statistical test and discard the point if it fails the threshold. [4] However, a responsible approach demands pausing for investigation, especially given the diverse causes identified above. Before applying any mathematical test like the Z-score or IQR rule, it is prudent to trace the data point back to its origin.
Here is a quick mental checklist for approaching any significant outlier:
- Identify: Locate the exact record and variable causing the deviation.
- Verify: Check the surrounding data points for that same record. Does this one point look suspicious, or is the entire record skewed (suggesting a multi-variable error)?
- Trace: If possible, locate the original source document or raw instrument log for that specific reading. Was it typed correctly? Was the machine running correctly at that time?[5]
- Classify: Based on verification, categorize the outlier: Is it a Data Entry Error (correctable), a Process Failure (systematic issue requiring equipment review), or a True Extreme (valid data requiring specialized statistical handling)? [1][5]
This careful classification is important because the subsequent action is dictated by the cause. If it is a correctable data entry error, fixing the transcription makes the dataset more accurate. If it is a true extreme, removing it biases the model toward the average case, potentially masking important real-world variation. [5] Treating a systematic measurement error as a natural extreme leads to flawed models, but deleting a genuine rare event removes important information about the process's full range of capability. [3] The source of the deviation is the primary determinant of how, or if, the value should be adjusted or retained. [6]
Related Questions
#Citations
All you need to know about outliers- causes, types and methods to ...
Outlier - Wikipedia
What makes Outlier Detection a Crucial Step in Robust Data Analysis?
Identifying outliers - Support - Minitab
A note on detecting statistical outliers in psychophysical data - PMC
7.1.6. What are outliers in the data?
What is an Outlier in Math? - DreamBox Learning
Statistical Outliers in the Laboratory Setting
Identifying Statistical Outliers in your Survey Data - Alchemer