What distinguishes precision from accuracy?
The terms precision and accuracy are often used interchangeably in casual conversation, yet in scientific, engineering, and quality control contexts, they describe fundamentally different attributes of a measurement or a system. [1][2] Mistaking one for the other can lead to flawed conclusions, costly errors in manufacturing, or misplaced trust in data sets. [5] Understanding the true separation between these concepts is not merely an academic exercise; it is the basis for knowing whether your results are close to the right answer or just consistently near each other. [4]
# Core Definition
Accuracy relates to how close a measurement or the average of a set of measurements is to the true or accepted reference value. [7] If you are trying to hit a specific target, accuracy describes how close your shots land to the bullseye. [9] In technical terms, accuracy is often discussed alongside trueness and bias. Trueness refers to the agreement between the average of measurements and the true value, while bias is the systematic error, or the difference between the average of measurements and the true value. [7] Therefore, high accuracy implies low bias. [7]
Precision, on the other hand, describes the degree of agreement among repeated measurements when the same procedure is applied repeatedly to the same object under the same conditions. [1][4][5] It is a measure of reproducibility or repeatability. [4] If you shoot ten arrows and they all cluster tightly together, regardless of where that cluster lands on the target, you have demonstrated high precision. [9] This concept is often associated with the resolution or the smallest difference in readings an instrument can reliably detect. [4]
# Target Analogy

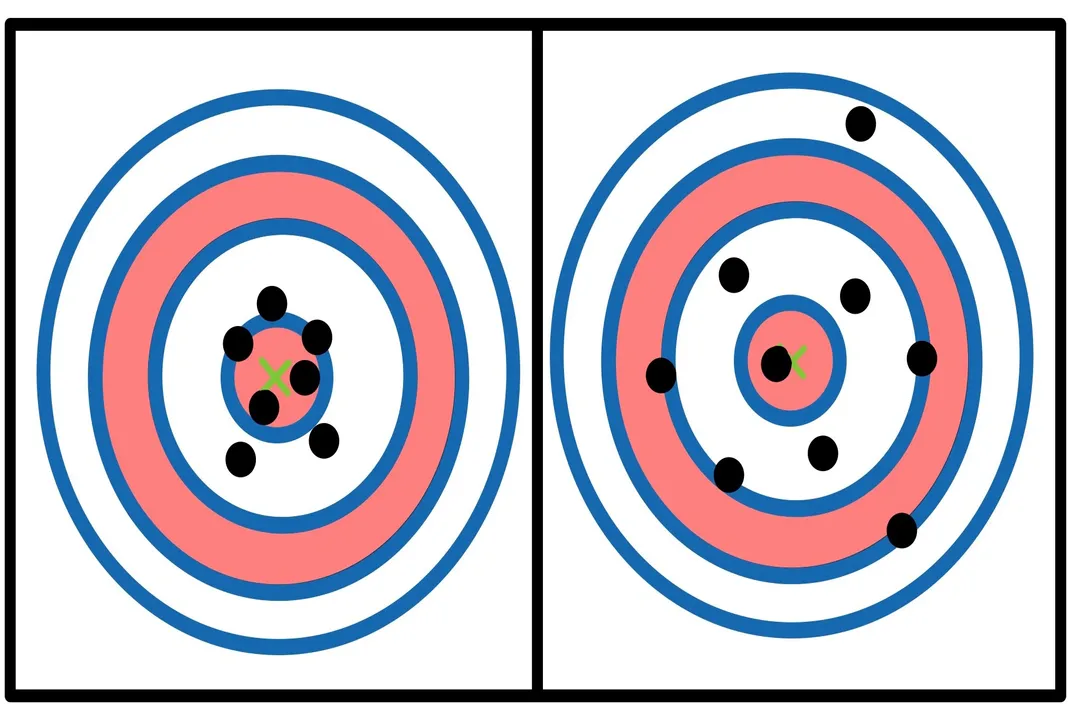
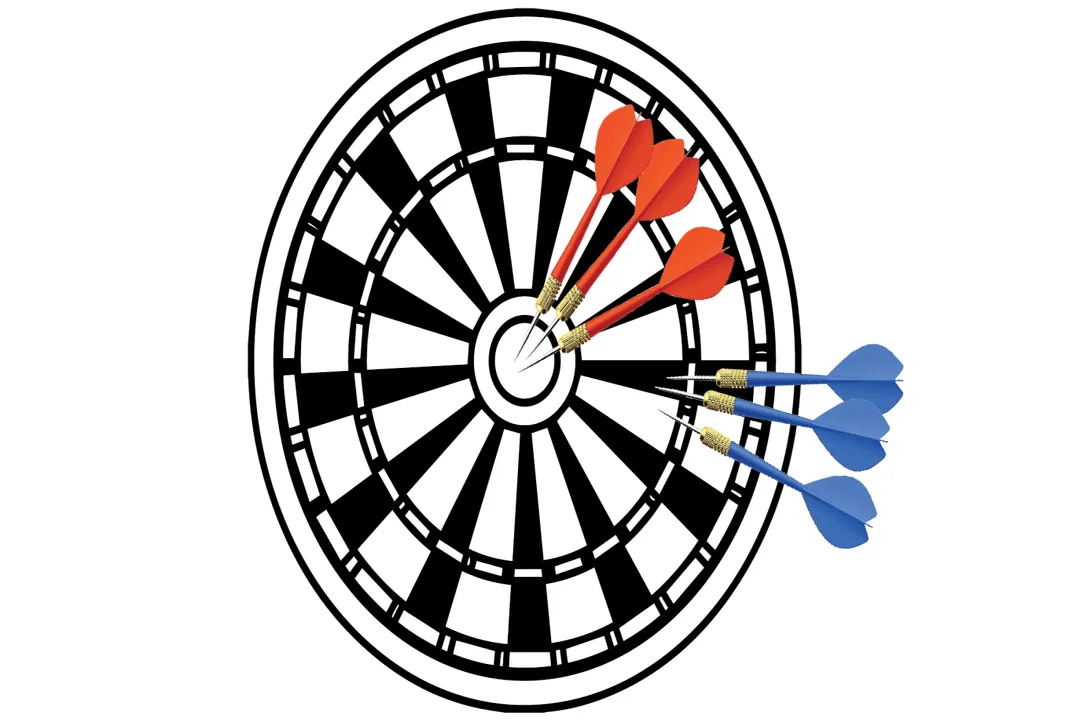
The classic way to illustrate this difference involves imagining a dartboard or target, a common visual aid used across many technical fields. [3][9]
# Hitting the Mark
When considering the four possible outcomes of a measurement process, the target visualization helps map the abstract concepts onto a concrete image:
- High Accuracy, High Precision: All shots are clustered tightly and centered directly on the bullseye. This is the ideal scenario where the instrument or process is both highly repeatable and correctly calibrated to the true value. [1][5]
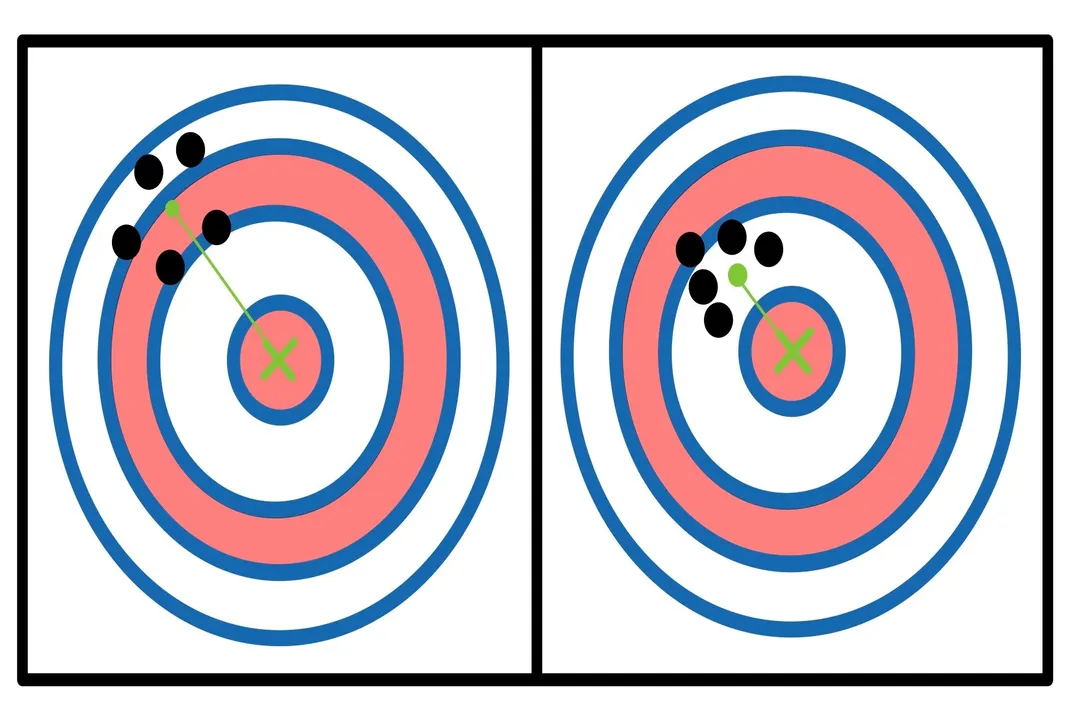
- Low Accuracy, High Precision: All shots are clustered tightly, but the entire cluster is significantly off-center, perhaps landing far away from the bullseye. The process is highly repeatable, but it is systematically incorrect—it has a high bias. [7]
- High Accuracy, Low Precision: The shots are scattered widely across the board, but the average position of all the shots lands near the bullseye. There is no systematic error (low bias), but the individual measurements lack consistency. [4][7]
- Low Accuracy, Low Precision: The shots are scattered widely all over the board, and the average position is also not near the bullseye. This indicates a problem with both consistency and calibration. [1]
This visual distinction clarifies that you can have excellent precision without ever hitting the true mark, and you can have a collection of measurements that average out to the correct value even if the individual readings were wildly inconsistent. [9]
# Trueness Versus Accuracy
For those working in metrology or rigorous scientific testing, the distinction between accuracy and trueness is important, though the terms are often conflated. [7] While accuracy is the general term for closeness to the true value, some define it as including both random errors (precision) and systematic errors (bias). [7] Trueness, conversely, specifically describes the systematic error component; it is the measure of how far off the average reading is from the true value. [7]
If a digital scale is consistently reading $1.02$ grams when measuring a known $1.00$ gram weight—and every measurement yields $1.02$ grams—the scale has high precision, zero random error, and a bias of $+0.02$ grams. Its trueness is poor because the average reading ($1.02$g) does not match the true value ($1.00$g). [7] If, however, the scale sometimes reads $1.00$, $1.04$, and $1.00$, its trueness might still be centered near $1.01$g (better than the first example), but its precision would be worse due to the higher scatter. [1]
# Precision in Practice
Precision is fundamentally about the consistency of the measuring tool or method. [5] In fields like precision machining or chemical analysis, high precision is often sought because it reduces the noise in the data, making it easier to spot trends or systematic drift. [6]
# Sources of Imprecision
When measurements show poor precision, the root cause is typically attributed to random error. [1] This error is unpredictable and varies from one measurement to the next. [1] Potential sources of random error include:
- Environmental fluctuations, such as slight temperature or humidity changes affecting a sensor. [5]
- Operator inconsistency, where different technicians might place a probe slightly differently during a manual measurement. [6]
- Instrument noise inherent in the sensing element itself.
A low-precision reading means that if you take a measurement now, you cannot be certain that the next measurement, taken under seemingly identical conditions, will be close to the first. [4] Improving precision often requires upgrading equipment, stabilizing the environment, or implementing more rigorous, standardized operating procedures (SOPs). [5]

# Accuracy in Application
Accuracy speaks directly to the validity of the measurement; it confirms that the system is measuring what it is intended to measure. [2] A high-accuracy reading confirms that the result is trustworthy and aligns with established standards. [4]
# Sources of Inaccuracy
Inaccuracy, when separated from precision, is largely caused by systematic error or bias. [1][7] This error is consistent across all measurements taken under the same conditions. Common causes include:
- Calibration Errors: The instrument was not properly zeroed or aligned with a known standard before use. [7]
- Instrument Drift: Over time, the internal components of a measuring device can shift, causing a consistent offset that requires periodic recalibration. [6]
- Methodological Flaws: Using an inappropriate formula or making incorrect assumptions in the data processing steps can introduce a constant error. [1]
If a system has high accuracy, you know that even if your individual results scatter a bit (low precision), the center of that scatter is correct. [7] Achieving high accuracy typically necessitates rigorous calibration against certified reference materials. [6]
# The Trade-Off Dilemma
In many real-world scenarios, resources—time, money, and expertise—limit the ability to achieve perfect accuracy and perfect precision simultaneously. [2] Therefore, practitioners must prioritize based on the application's needs.
Consider a company managing its project backlog, as tracked in a system like Asana. If they are measuring task completion time:
- High Precision/Low Accuracy: If every task consistently takes exactly 4 hours, but the initial estimate was 2 hours, the process is precise (repeatable adherence to a wrong value), but inaccurate. The system consistently overestimates. [3] The fix here is adjusting the baseline estimate or understanding why the work takes 4 hours, rather than just trying to make the work faster randomly.
- High Accuracy/Low Precision: If tasks sometimes take 1.5 hours and sometimes 3.5 hours, but the average is 2.5 hours (near the 2-hour goal), the process has acceptable accuracy but terrible precision. The problem here is variability. A single task might severely impact a deadline, even if the long-term average is fine. [3] The fix here involves standardizing how the work is done to reduce the swing in completion times.
This situation highlights a core operational reality: If you are struggling with consistency across your operational measurements, focus on increasing precision first, as high precision makes identifying the source of systematic bias much easier. [5] If your readings are all over the place, the bias is obscured by noise. Once the noise is reduced, the true offset (bias) becomes obvious and can be corrected through recalibration or procedural changes. [7]

# Deeper Look at Measurement Quality
To assess the overall quality of a measurement technique, quality experts look at more than just the target analogy; they consider related concepts like resolution and uncertainty. Resolution, which is sometimes incorrectly equated with precision, is the smallest increment an instrument can display or register. [4] An instrument might have a resolution of $0.1$ mm, but if its precision is only mm, that display resolution is meaningless noise. [4]
A good measure of overall quality integrates both concepts into a single uncertainty budget. The uncertainty of a measurement accounts for both the random scatter (imprecision) and the estimated systematic offset (bias/inaccuracy). [1] In high-stakes environments, like calibrating medical devices or testing aerospace components, the uncertainty must be quantified and kept significantly smaller than the tolerance limits of the part being tested. [6]
To provide a tangible example of the analytical difference: imagine a baker checking the weight of flour bags, which are supposed to be exactly $25.000$ kg.
| Measurement Set | Average Weight | Deviation from $25.000$ kg | Repeatability (Spread) | Assessment |
|---|---|---|---|---|
| Set A | $25.001$ kg | Very Low | Very Low (e.g., kg) | High Accuracy, High Precision |
| Set B | $25.050$ kg | Low Bias | Very Low (e.g., kg) | High Precision, Low Accuracy (Needs calibration) |
| Set C | $25.000$ kg | Zero Bias | Very High (e.g., kg) | High Accuracy, Low Precision (Needs stabilization) |
The baker in Set B knows exactly how much to adjust their filling machine's target setting (the bias is known and small), while the baker in Set C has a machine that sometimes overfills and sometimes underfills, making their process unpredictable. [3]
# Procedural Improvement
When seeking to improve data integrity, the initial step should always involve isolating the source of error. If you are using a simple stopwatch to time laps in a race, both precision and accuracy can be compromised by human reaction time.
If the timekeeper flinches slightly before the starting gun (systematic reaction time lag), the resulting times will be consistently low—high precision, low accuracy (bias). [7] If the timekeeper starts the watch at varying points after the gun fires due to momentary lapses in attention, the times will be inconsistent—low precision, but perhaps averaging out to the correct time (high accuracy, low precision). [1]
A practical tip for anyone managing data acquisition, whether in a lab or an office environment, is to always include control checks based on known standards. For instance, if tracking the time it takes for a software script to process a standard input file:
- Establish the target time (The true value).
- Run the script ten times with the exact same file and no other processes running (Testing precision).
- If the results cluster tightly, but are consistently 5 seconds slower than the target time, you have identified a bias (Low accuracy) that might be due to background system processes or outdated dependencies that need tuning. [6]
This methodical isolation—first locking down repeatability, then addressing the offset—is the most effective path to measurement excellence, preventing the costly mistake of trying to "tune" a system that is fundamentally unstable. [5] Precision is the prerequisite for confidently diagnosing inaccuracy. Without tight repeatability, any apparent accuracy could simply be luck rather than good measurement technique. [4]
#Videos
Accuracy vs. Precision - YouTube
Related Questions
#Citations
Accuracy and precision - Wikipedia
The Difference between Accuracy and Precision Measurements
What's the difference between accuracy and precision? - Asana
Accuracy vs Precision: What is the Difference? | Ossila
Accuracy vs Precision - Mensor Blog
Accuracy vs precision - what is the difference?
The difference between precision, trueness and accuracy - dewetron
Accuracy vs. Precision - YouTube
The difference between "accuracy" and "precision" : r/coolguides