What is a large scale structure?
The cosmos, when viewed on the grandest scales, does not appear as a uniform, smooth expanse of stars and galaxies. Instead, it reveals an intricate, almost foam-like architecture known as the Large-Scale Structure of the Universe (LSS). [1][4] This term describes the way matter—galaxies, clusters, and superclusters—is distributed across the observable universe, organized into vast filaments and walls separated by enormous stretches of seemingly empty space. [2][5] It is the scaffolding upon which everything we see is hung. [3] This structure is the largest known organization of matter, representing the culmination of gravitational processes acting over nearly the entire age of the universe. [1][7]
# Cosmic Web
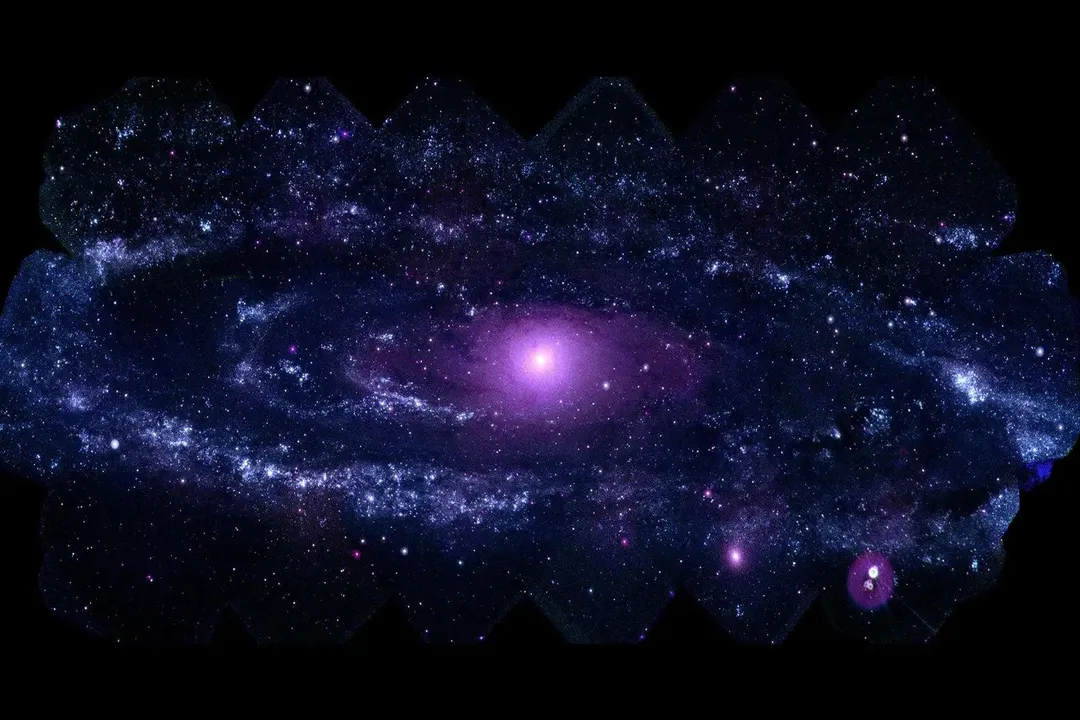
The primary visualization used to describe the LSS is the Cosmic Web. [4] This structure is not a simple, random scattering of objects; rather, it has a distinct topology characterized by density enhancements and corresponding depletions. [6] Imagine a sponge or a network of interconnected threads spanning the cosmos.
The densest regions are where matter has congregated most effectively. These include galaxy clusters and superclusters, which are the nodes where multiple filaments intersect. [1][5] Surrounding these dense regions are filaments and sheets—long, rope-like structures and vast, relatively flat planes composed of numerous galaxies and smaller groups. [1][4] These filaments are the highways of the universe, channeling gas and galaxies toward the massive knots. [5]
Contrasting sharply with these structures are the voids. [4][6] These are immense, nearly spherical regions containing very few galaxies or galaxy clusters. [1] They represent the areas where the initial density was slightly lower than average, meaning gravity had less material to work with, resulting in a relative dearth of structures over cosmic time. [5] The distribution of matter is thus inhomogeneous, characterized by these alternating high-density structures and low-density voids. [1][6]
# Size Scales
The sheer scale of these structures is difficult to grasp without comparison. The filaments and walls that comprise the LSS stretch over hundreds of millions of light-years. [1][4] For instance, the Sloan Great Wall, one of the largest identified structures, extends over 1.37 billion light-years in length. [5]
However, this clumpiness is not infinite. A fundamental concept in cosmology is the Cosmological Principle, which posits that on sufficiently large scales, the universe becomes statistically homogeneous and isotropic (the same in all locations and directions). [1][6] Observations suggest that the LSS transitions from this web-like organization into relative uniformity at scales exceeding about $300$ million light-years, or roughly $100$ to $300$ megaparsecs. [1][6]
To put this into perspective: if a typical galaxy cluster is the size of a small city in this cosmic map, the voids would be empty rural counties, and the filaments would be massive interstate highway systems connecting the cities. The entire observable universe, however, is so vast that these structures, while massive on human terms, only occupy a fraction of the total volume before the universe settles into a smooth statistical average. [1]
# Early Seeds
These majestic structures did not simply appear late in cosmic history; they have been growing since the very beginning. [5] The origin of the LSS lies in tiny quantum fluctuations present in the universe immediately following the Big Bang, a period known as inflation. [1][5] These fluctuations represented minute variations in density—some regions were infinitesimally denser than others. [1]
Over time, gravity acted upon these slightly overdense regions, causing them to pull in more surrounding matter. Conversely, the slightly underdense regions lost matter to their denser neighbors. [5] This process of gravitational instability is an amplification mechanism: small initial density differences become larger and larger over billions of years. [1][5] The resulting web structure is a direct consequence of these initial conditions being stretched and molded by gravity throughout the universe's history. [6]
# Dominant Ingredients
Understanding the formation of the LSS requires accounting for the major components of the modern universe as described by the standard CDM model. [3][5] While we see stars and luminous galaxies forming the visible parts of the web, the structure itself is overwhelmingly dictated by dark matter. [3][5]
Dark matter is the gravitational scaffolding of the universe. [3] It interacts with itself and normal matter only via gravity, meaning it was not inhibited by the intense radiation pressure in the early universe that smoothed out the distribution of normal (baryonic) matter. [5] Dark matter halos—the gravitational wells created by concentrations of dark matter—formed first, providing the initial potential wells into which baryonic matter later fell to form stars and galaxies. [5]
In contrast, dark energy () plays an opposing, though critical, role. [3][5] Dark energy is responsible for the accelerating expansion of the universe. [3] This acceleration works to stretch the entire cosmic web apart, effectively slowing down the growth of the LSS at later times. Therefore, the structure we observe is a delicate balance: gravity (dominated by dark matter) pulling things together to form the web, and dark energy pushing everything apart, preventing the web from collapsing further or growing indefinitely. [5]
If you were to run a computer simulation of structure formation, you would find that removing dark matter results in a universe that remains almost entirely smooth, as normal matter alone lacks the necessary gravitational dominance to create the observed clustering over the required timescale. [5]

# Mapping Effort
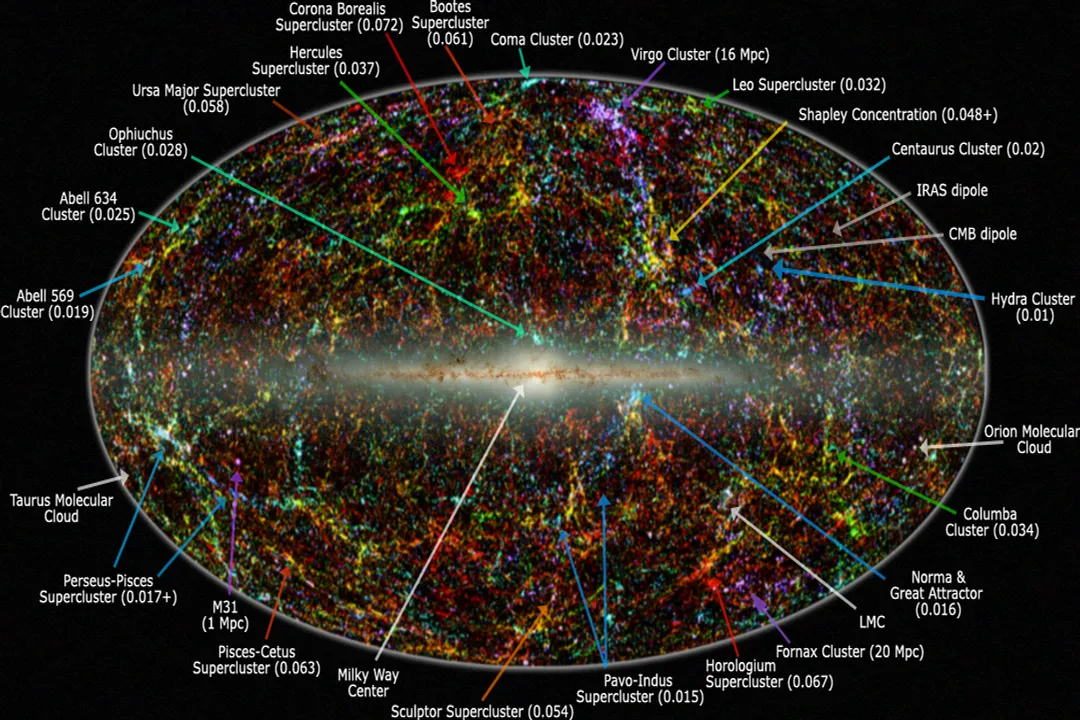
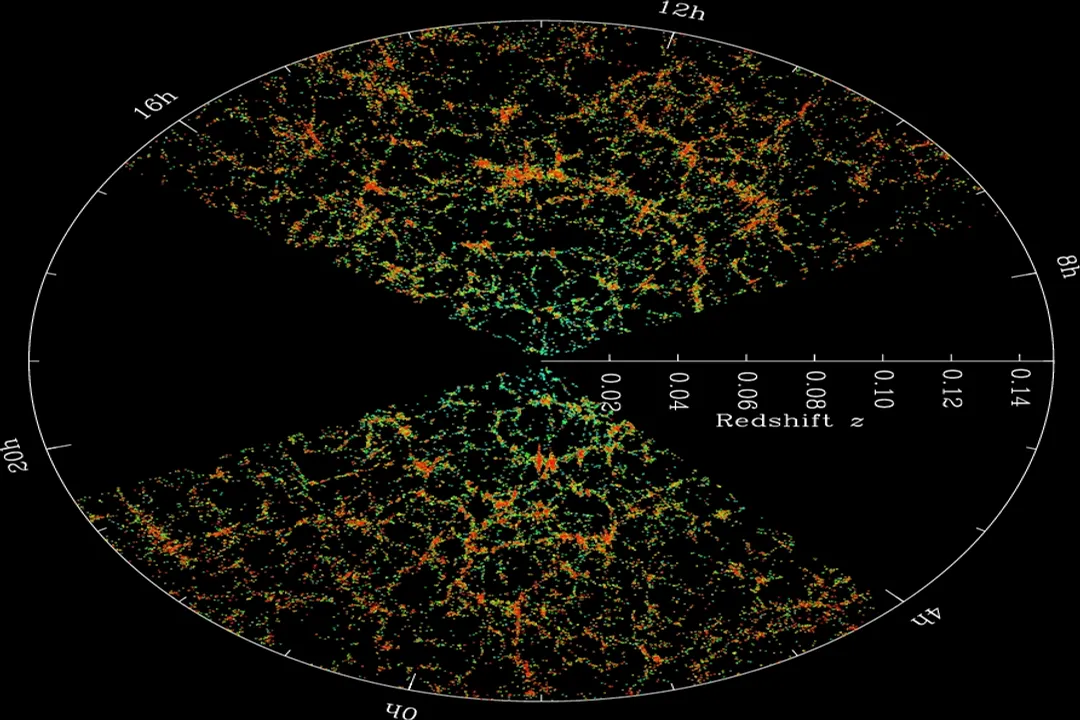
To study this three-dimensional arrangement, astronomers must be able to map the location of millions of galaxies throughout deep space. Since light takes time to travel, looking farther away means looking back in time. [4] The key technique used to create these enormous 3D maps is redshift surveys. [6]
The process of converting a faint smudge of light into a precise coordinate in the cosmic web involves a few critical steps that are often simplified for general understanding:
- Detection and Spectroscopy: Telescopes capture the light from a distant galaxy. [6] Astronomers then use a spectrograph to break that light down into a spectrum, revealing the unique chemical fingerprints of the elements within the galaxy. [6]
- Measuring Redshift: By comparing these measured spectral lines to known laboratory wavelengths, astronomers calculate the galaxy's redshift (how much its light has been stretched toward the red end of the spectrum due to the universe's expansion). [6]
- Calculating Distance: This redshift value is directly proportional to the velocity at which the galaxy is moving away from us due to cosmic expansion, which allows astronomers to calculate its approximate distance if they use a known cosmological model for the expansion rate. [6]
- Assigning Coordinates: The celestial coordinates (right ascension and declination) combined with the calculated distance yield the galaxy's 3D location in space. [6]
Massive international projects, such as the Dark Energy Survey (DES), have been instrumental in mapping millions of galaxies to better constrain the nature of dark energy by analyzing how the LSS has evolved. [3] Other legacy projects like the Sloan Digital Sky Survey (SDSS) laid the foundation for this work. [5] These surveys provide the empirical data needed to test and refine our theoretical models of cosmology. [7]
# Statistical Measure
While visualizing the Cosmic Web is compelling, scientists quantify the structure using mathematics derived from probability. They move beyond simply cataloging filaments and voids to measure how clustered the universe is compared to a purely random distribution. [9]
One of the most foundational metrics is the Two-Point Correlation Function, often denoted as . [9] This function measures the probability of finding two galaxies separated by a specific distance , compared to the probability of finding them at that distance if the universe were perfectly random (homogeneous). [9]
If is greater than zero for a certain distance , it means galaxies are more likely to be found near each other at that separation than by chance—indicating clustering. [9] If it is less than zero, they are less likely to be found near each other, indicating voids or anti-clustering. [9] By measuring this function across vast ranges of scale, researchers can create a statistical fingerprint of the LSS that can be directly compared to the predictions made by N-body simulations, which model the gravitational collapse of dark matter over time. [9]
When analyzing data, one must remain acutely aware of the observational bias inherent in these surveys. Surveys typically sample galaxies in layers defined by redshift, which means the observed samples are not perfectly uniform in space. The Effective Volume surveyed—the actual volume within which the survey has enough statistical power to reliably detect objects—must be carefully calculated to avoid overestimating structure density in regions we sampled most deeply. [10]
# Future Insight
The study of the LSS is not static; it is rapidly evolving with new technologies. While historical surveys focused on mapping millions of galaxies, next-generation surveys are aiming for billions, or even utilizing quasars and the Cosmic Microwave Background (CMB) to probe structure in ways previously inaccessible. [3][5] One subtle but powerful comparison astronomers make is between the large-scale structure seen in the distribution of galaxies today and the structure imprinted on the CMB—the oldest light in the universe. [1] The CMB represents the initial conditions, a nearly uniform map of density fluctuations from about 380,000 years after the Big Bang. [1] The degree to which the modern galaxy map differs from the CMB map tells us precisely how much structure has grown over the last $13.8$ billion years. This difference acts as a cosmic clock, directly measuring the influence of dark matter and dark energy on structure growth over time. [3][5] The precision with which we can now measure this growth across cosmic time is providing tighter constraints on the fundamental constants describing our universe than ever before. [5]
#Videos
Understanding Large-Scale Structures in the Universe - YouTube
Related Questions
#Citations
Large-scale structure of the Universe - Simple Wikipedia
Large Scale Structure | Center for Astrophysics | Harvard ...
Large-Scale Structure - Dark Energy Survey
Large Scale Structures - NASA Science
Large-scale structure of the universe - Wikipedia
Large Scale Structure of the Universe - Alison L. Coil
Large-scale Structure In The Universe | Research Starters - EBSCO
Understanding Large-Scale Structures in the Universe - YouTube
[1202.6633] Large Scale Structure of the Universe - arXiv
Astronomers discover one of the Universe's largest spinning structures