How do confidence intervals inform estimates?
When we survey people, run an experiment, or analyze data, we often end up with a single number—a point estimate—that summarizes what we found. Maybe the average time spent on a webpage was 2 minutes, or perhaps 65% of users clicked the new button. However, that single number, by itself, only tells half the story because it provides no indication of how certain we are about it. [1][2] This is where confidence intervals (CIs) become indispensable. They do not replace the point estimate; rather, they surround it, giving us a range of plausible values for the true population parameter we are trying to measure. [5][9]
# Defining Intervals
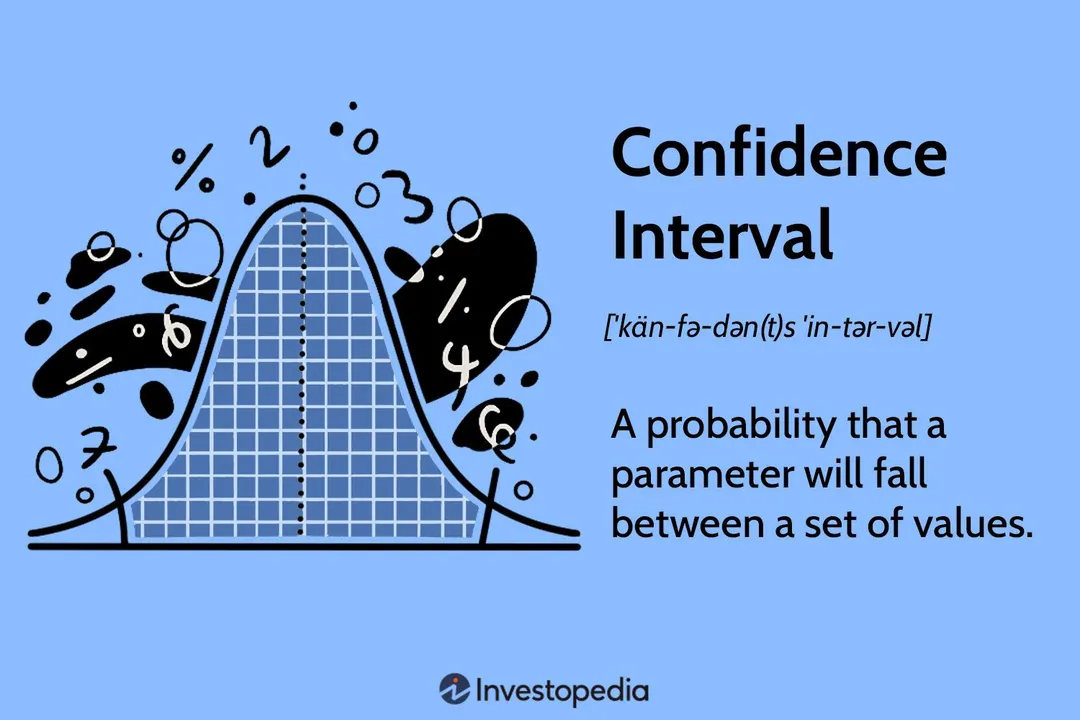
A confidence interval provides a range of values that is likely to contain the true population parameter of interest. [2][9] The level of confidence, frequently set at 95%, defines the reliability of the estimation procedure itself. [2][4][6] When a statistician states they are 95% confident, they are asserting that if they were to repeat the exact sampling process numerous times, 95% of the resulting intervals calculated from those samples would successfully capture the true, unobservable population value. [4][6] It is important to distinguish this from the probability of the true value falling within this specific, single interval—that probability is either 1 (it's in there) or 0 (it's not); the confidence relates to the process that generated the interval. [9]
# Components Measurement
The construction of a confidence interval relies on three main elements: the point estimate, the margin of error, and the standard error. [1][5] The CI is fundamentally calculated by taking the calculated sample statistic (the point estimate) and adding or subtracting a calculated distance known as the Margin of Error (MOE). [1][4]
The MOE is derived from two primary factors:
- The Desired Confidence Level: Higher certainty demands a wider net. Moving from a 90% to a 99% confidence level will always increase the MOE, assuming sample size remains constant. [2][5]
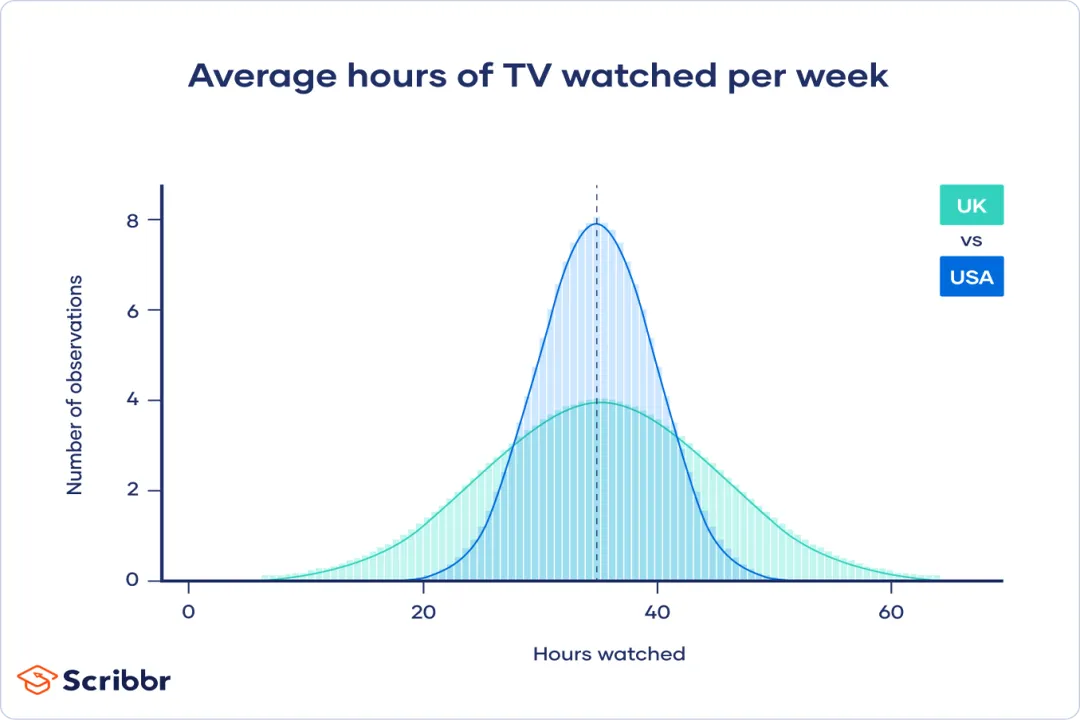
- The Standard Error: This term quantifies the expected variability or noise in the sample statistic due to random sampling. [5] The standard error is inversely related to the square root of the sample size. [7] A larger sample size reduces the standard error, which in turn shrinks the MOE, leading to a narrower, more precise interval. [2][5]
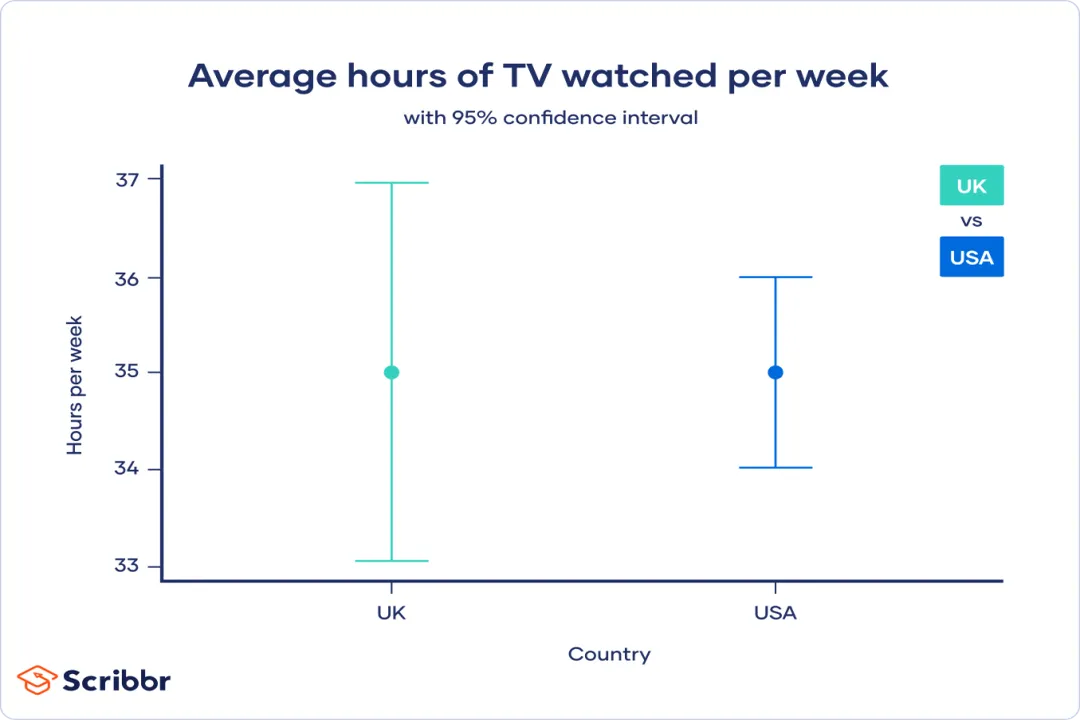
A narrow interval signals high precision and strong evidence supporting the point estimate, while a very wide interval indicates a high degree of uncertainty about the true population value. [1][3]
# Interpreting Results
Misunderstanding confidence intervals is extremely common, even among those who use statistics daily. A common incorrect interpretation is stating, "There is a 95% chance the true mean falls between X and Y". [9] Because the true mean is a fixed value, this statement is technically inaccurate for a single realized interval.
The technically correct interpretation centers on the method: "We are 95% confident that the true population parameter lies within this calculated interval". [4][6] If a software company estimates that the average daily active users (DAU) for a new feature is between 10,500 and 11,500 based on a 99% CI, it means that if they re-ran the data collection and calculation ninety-nine times out of one hundred, the resulting range would contain the actual DAU for the entire population of users. [5]
# Precision Factors
The width of the interval directly informs the practical utility of the estimate. [3] In many real-world estimation tasks, how close you are to the truth matters as much as being in the right ballpark.
Consider this trade-off: If a study reports an estimate for the proportion of defective parts as (a narrow 95% CI), that high precision suggests the manufacturing process is very stable. If another process yields an estimate of (a wide 95% CI), the point estimate of $4.2%$ is much less useful for immediate quality control decisions because the true rate could plausibly be as low as $-0.8%$ or as high as $9.2%$. [1]
When evaluating reports, understanding the sample size is key to evaluating the precision offered by the CI. A very small sample size will almost always result in a broad CI, regardless of how confident we are. Conversely, a very large sample size can produce an extremely tight interval, providing a highly precise estimate, even if the underlying phenomenon being measured is intrinsically noisy. [2][7]
# Informing Estimates Practice
In applied fields, especially in product development and experimentation, confidence intervals move estimation from an academic exercise to a tool for calculated risk-taking. [3] This is most evident when comparing two groups, such as in A/B testing where you are looking at the difference in conversion rates between two website designs. [8]
If you calculate the 95% CI for the difference in conversion rates and that interval includes zero—for example, it spans from $-0.5%$ to $+1.5%$—it signals that zero difference is a statistically plausible outcome. [3][8] In this case, while the point estimate might favor Design B by $1.0%$, the interval tells you the true benefit could realistically be negative (meaning B is worse) or zero. This lack of statistical evidence suggests caution before deploying Design B company-wide.
When evaluating these comparisons, it's helpful to look not just for overlap, but for the magnitude of the overlap relative to the point estimates themselves. A slight overlap when both means are very far from zero suggests a small, perhaps negligible, practical difference, whereas an overlap centered near zero signals true statistical ambiguity. [3] The CI helps frame whether an observed difference is likely due to true effect or just sampling variation.
# CI Population Averages
When estimating an average value for a population, the confidence interval provides crucial context for the point estimate when compared against known standards or thresholds. [4] This framing moves the discussion from pure statistics to actionable engineering or policy limits.
Imagine tracking the average daily energy consumption for a large facility. If the 90% CI for last month's usage is calculated to be [1,200 kWh, 1,250 kWh], and the operational mandate sets the hard ceiling at 1,300 kWh, the interval gives immediate, high-confidence assurance that the average performance was safely below the threshold. [4] If the lower bound of that interval (1,200 kWh) was still above the facility’s historical low for that month (say, 1,150 kWh), it immediately flags the current period as unusually high usage, even if the point estimate (1,225 kWh) seems acceptable on its own merit against the 1,300 kWh mandate. This use of the CI's boundaries against known performance metrics helps contextualize uncertainty in operational reporting. [4]
# Statistical Decisions
Confidence intervals are not just descriptive tools; they are directly equivalent to formal hypothesis testing procedures, offering an alternative lens through which to view statistical significance. [7]
For instance, if you are testing a null hypothesis that there is no difference between the average recovery time for two patient groups (i.e., the difference is zero), you can use the CI of that difference. If the 95% CI for the difference in recovery times is calculated to be (2.1 days to 4.5 days), you would reject the null hypothesis at the significance level because the hypothesized value of zero is entirely excluded from the calculated range. [1][7] If, however, the 95% CI had spanned zero, say from -1.0 days to 3.0 days, you would fail to reject the null hypothesis, as zero remains a plausible value based on the observed data. [7] The CI efficiently communicates the results of both the magnitude (the interval range) and the statistical significance (whether the hypothesized value is contained) simultaneously. [1]
# Limits Certainty
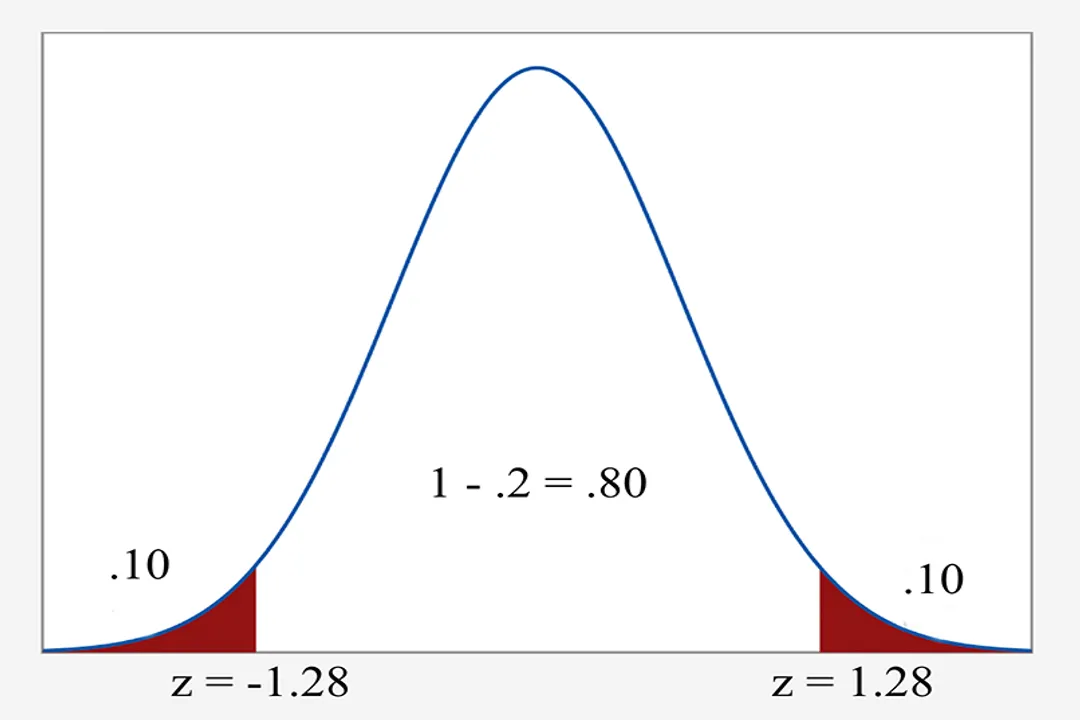
Because confidence intervals are derived from samples, which inherently contain randomness, it is mathematically impossible to construct a CI that guarantees 100% coverage of the true population parameter. [5][9] To claim 100% confidence, the margin of error would have to extend infinitely in both directions, resulting in an interval that contains every possible value—making the estimate useless. [5] Statistical inference, therefore, always involves accepting a small, calculated risk of error. We choose levels like 90%, 95%, or 99% to manage this known, quantified risk inherent in using a subset of data to describe a larger whole. [6]
Related Questions
#Citations
What Is a Confidence Interval and How Do You Calculate It?
Understanding Confidence Intervals | Easy Examples & Formulas
Confidence intervals: What they are and how they help in data ...
Explaining Confidence Intervals for Average Values
Showing confidence (intervals) - PMC - NIH
Confidence Intervals - NM-IBIS
5 Confidence Intervals – STAT 500 | Applied Statistics
Understanding Confidence Intervals and How to Calculate Them
[PDF] What are confidence intervals and p-values?