What is the purpose of a spectrometer?
The fundamental objective of a spectrometer is to measure the intensity of light or other electromagnetic radiation across a specific range of wavelengths. [4][9] Essentially, it acts as a highly sophisticated scientific eye, breaking down light—which appears white or uniform to us—into its constituent colors, much like a prism does, but with far greater precision and analytical capability. [2][9] This process separates incoming radiation based on its wavelength, allowing scientists to determine what materials are present or how they are behaving based on the unique way they absorb, emit, or scatter that light. [2][5] The resulting measurement is a spectrum: a graphical representation showing how the measured intensity changes as the wavelength changes. [1][2] This spectral signature, sometimes likened to a unique molecular fingerprint, is the key to unlocking information about the physical and chemical properties of the sample being analyzed. [1][5]
# Basic Parts
A typical modern spectrometer, whether built for visible light or other parts of the electromagnetic spectrum, relies on a few core components working in sequence to achieve this separation and measurement. [2][9] While designs vary significantly based on the radiation range being studied—from UV to infrared—the principle of dispersion remains constant. [4]
# Radiation Input
The process begins with the sample interacting with radiation, which might be generated by an external source, or the sample itself might be emitting the radiation (like a hot gas). [2][5] Regardless of the source, this radiation must be carefully introduced into the instrument, typically through an entrance slit. [2][9] This slit serves a critical function: it limits the beam of light entering the system, defining the initial spatial resolution and ensuring that the light hitting the dispersing element is highly collimated, meaning its rays are nearly parallel. [2] A narrow slit generally leads to better spectral resolution—the ability to distinguish between two closely spaced wavelengths—but at the cost of overall light throughput or signal strength. [9]
# Dispersion Element
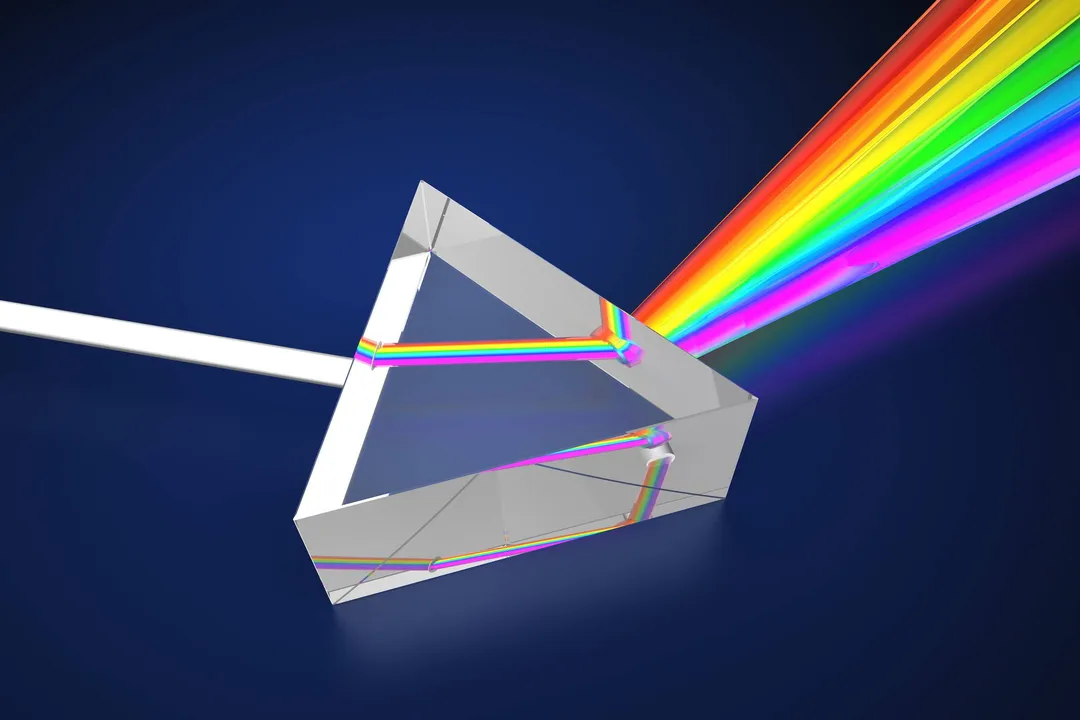
Once through the slit, the radiation enters the heart of the spectrometer: the dispersing element. [2] This component is responsible for taking the mixed light beam and spatially separating the different wavelengths. [4] The two primary tools used for this separation are prisms and diffraction gratings. [2][4]
Prisms separate light based on refraction, meaning the amount a beam bends (refracts) depends on its wavelength; shorter wavelengths (like blue) bend more than longer ones (like red). [4]
Diffraction gratings, which are reflective or transmissive surfaces etched with thousands of precisely spaced parallel grooves, operate based on diffraction and interference. [4] When light strikes a grating, the grooves cause the light to spread out, and the different wavelengths exit at slightly different angles, effectively sorting them out spatially. [4] Gratings are often favored in modern instruments because they provide a more uniform dispersion across the spectrum compared to prisms. [2]
# Detection System
After the dispersing element sorts the radiation, the resulting separated light path must be measured. [2][9] This is where the detector comes in. In older or simpler instruments, like a spectroscope, this might simply be the human eye looking through an eyepiece to observe the distinct spectral lines. [4] However, modern analytical spectrometers use electronic detectors, often an array or CCD (Charge-Coupled Device) sensor, much like a sophisticated digital camera sensor. [8]
This detector captures the dispersed light, measuring the intensity at each specific position corresponding to a particular wavelength. [8] The resulting data stream is a series of intensity values mapped to spatial locations, which is then converted by onboard electronics into the final, usable spectral graph of intensity versus wavelength. [8] The sensitivity and dynamic range of this detector heavily influence the quality and utility of the final spectrum. [9]
# Spectrum Defined
The output—the spectrum—is the entire point of the measurement. [1] It is a plot or graph where the horizontal axis represents the wavelength (or frequency/wavenumber, depending on the system setup) and the vertical axis represents the intensity or power detected at that specific wavelength. [1][2]
# Molecular Fingerprinting
The significance of this plot lies in the fact that every element, molecule, or chemical compound exhibits a unique spectral fingerprint. [5] This uniqueness arises from the quantum mechanical nature of matter. Electrons in atoms and molecules can only exist at specific, discrete energy levels. [5] When a sample absorbs energy (like light), its electrons jump to higher energy states; when they return to a lower state, they release that energy as light of a specific wavelength. [2][5]
If the sample is absorbing light from a continuous source, the resulting spectrum will show absorption lines—dips or troughs in the intensity plot where energy was removed at those specific wavelengths. [2] Conversely, if the sample is excited (e.g., by heat or electric current) and emitting its own light, the spectrum will show emission lines—sharp peaks corresponding to the exact wavelengths of energy released. [5] Analyzing the position of these peaks or troughs allows for identification (qualitative analysis), while measuring their depth or height allows for determination of concentration or quantity (quantitative analysis). [2][5]
# An Example of Spectral Analysis
Consider analyzing a contaminated water sample in an environmental testing lab. You might pass a beam of UV light through the sample. [2] If the water contains trace amounts of a known organic pollutant, that specific pollutant will absorb UV light at, say, 280 nanometers (), creating a clear dip in the spectrum at that wavelength. [5] By matching the position of the dip to known library data, you confirm the presence of the pollutant; by measuring how deep the dip is, you can calculate the concentration of that pollutant in the water sample. [2] This direct relationship between spectral features and material properties is what makes the spectrometer such a versatile tool across many fields. [3]

# Instrument Types
While the term "spectrometer" is often used generally, subtle distinctions exist between closely related instruments, often related to how the output data is collected and presented. [4]
# Spectroscope Versus Spectrograph
A spectroscope is fundamentally an instrument designed for visual observation. [4] It takes the dispersed light and presents it directly to an eyepiece for a human observer to view the spectrum in real-time. [4] It provides immediate, qualitative feedback.
A spectrograph, on the other hand, is designed to record the spectrum permanently or digitally. [4] It replaces the eyepiece of a spectroscope with a detector array or photographic plate, allowing for time-integrated measurements and detailed, post-processing analysis of the recorded data. [4] The term spectrometer is often used interchangeably with spectrograph in modern contexts, especially when referring to electronic instruments that quantify the light intensity at each wavelength, which is the focus of most advanced analytical chemistry and physics applications today. [1][8] A spectrometer, therefore, is the measurement and quantification device, whereas a spectroscope is primarily for viewing. [4]
# Variations in Design
Beyond these naming conventions, the physical configuration dictates performance. Instruments might use a fixed-grating design where the detector array scans across the dispersed spectrum, or they might use a scanning spectrometer where a single point detector moves across the focal plane while the grating angle is precisely adjusted. [8] Modern high-throughput systems often favor the fixed-grating design for faster data acquisition across the entire range simultaneously. [8]
# Wide Uses
The ability to characterize light interaction makes the spectrometer indispensable across nearly every scientific and industrial discipline. [3][7] Its purpose is not singular but expands based on the application domain. [10]
# Materials Science
In materials research, spectrometers are used to characterize the composition and structure of new compounds or thin films. [6] For instance, analyzing the reflectance spectrum of a new solar cell material can reveal how effectively it absorbs photons across the solar spectrum, guiding improvements in efficiency. [6] Conversely, analyzing the emission spectrum from a material under laser excitation can reveal impurities or stress levels within the crystal lattice. [3] When looking at the spectral characteristics of coatings or layers, an optical profiler equipped with a spectrometer can map thickness variations across a surface, offering a non-destructive way to assess quality control in manufacturing. [6]
# Astronomy
Perhaps the most famous application is in astronomy, where spectrometers mounted on telescopes analyze the light arriving from distant stars and galaxies. [7] The purpose here is twofold: identification and kinematics. [7] By observing the specific patterns of absorption lines in a star's spectrum, astronomers can determine its chemical makeup—finding hydrogen, helium, iron, etc., millions of light-years away. [7] Furthermore, if the entire pattern of spectral lines is shifted toward the red end of the spectrum (redshift), it indicates the star or galaxy is moving away from us; a shift toward blue indicates movement closer (the Doppler effect). [7] This single measurement informs cosmology about the expansion rate of the universe. [7]
# Chemistry and Biology
In chemistry, spectroscopy is the backbone of compositional analysis. [2][10] Techniques like UV-Vis (Ultraviolet-Visible) spectroscopy are used routinely in biochemistry to measure protein concentrations or DNA purity by observing how samples absorb light in these regions. [2] In environmental monitoring, field-portable spectrometers are used to analyze air and water quality in real-time, providing rapid contaminant detection far superior to slow, centralized lab tests. [5]
A practical thought experiment for understanding spectral power: Imagine trying to identify someone in a dark room only by the sound of their voice. A spectroscope is like hearing the voice; you get an impression. A spectrometer is like recording the voice, analyzing the precise frequencies present, and comparing that complex pattern against a database of thousands of known voices to make an absolute identification. The more accurately you can measure the frequency intensity, the better the identification.
# Industrial Monitoring
In manufacturing, spectrometers provide constant quality assurance. [8] Process analytical technology (PAT) systems use near-infrared (NIR) spectrometers to monitor chemical reactions in real-time, ensuring that mixing ratios are correct or that reactions have reached completion before the batch is moved to the next stage. [8] This allows for immediate adjustments, minimizing waste and ensuring product consistency without needing to pull physical samples for slow lab analysis. [8]

# Interaction Basis
To fully grasp the purpose, one must appreciate the different ways radiation interacts with matter, which dictate the type of spectrometer needed. [2][5]
# Absorption and Transmission
When a continuous light source shines through a sample, the material absorbs specific photons corresponding to energy transitions within its atoms or molecules. [2] A spectrometer measures the light that transmitted through the sample. [2] If 100% of the light made it through, the spectrum would be flat at 100% transmission. If a substance absorbs 50% of the light at , the resulting spectrum shows a trough down to 50% transmission at that point. [5] This is the basis for UV-Vis and infrared spectroscopy. [2]
# Emission and Luminosity
Conversely, some processes cause the material itself to become the light source. [5] This is common in elemental analysis, such as using an atomic emission spectrometer. Here, the sample is excited (often by a flame or plasma), causing atoms to emit light as their electrons fall back to lower energy states. [5] The spectrometer measures the intensity of this emitted light across the spectrum. [5] The measurement technique is fundamentally reversed: we are not looking for dips in an external signal, but for the peaks that the sample generates. [2]
# Reflectance Analysis
A third major category involves reflectance. [6] Here, light is shone onto a surface, and the spectrometer measures the light bouncing off it. [6] This is vital for analyzing surfaces, pigments, or opaque materials where transmission is impossible. [3] The spectrum obtained tells you which wavelengths were not absorbed and were reflected away. For instance, a green leaf looks green because its chlorophyll strongly absorbs the blue and red ends of the visible spectrum, reflecting most of the green light back towards the detector. [6] Analyzing this reflected signal allows for remote sensing applications and surface characterization. [6]
# Data Capture
The evolution of the detector has fundamentally changed the accessibility and power of spectrometry. [8] Early systems were mechanical, slow, and often required manual data transcription. [4] Today’s digital detectors, whether linear arrays or 2D imaging sensors, provide high speed and sensitivity. [8]
When designing an experiment, one must balance resolution and speed. [9] Higher resolution demands that the dispersing element spreads the light out more widely and requires a detector with more, smaller pixels to resolve the fine spectral features. [9] This also means that fewer photons hit each individual pixel element per second, potentially lowering the signal-to-noise ratio unless the integration time (exposure time) is increased. [9] This trade-off is non-negotiable in instrument design. If you are looking for a very subtle trace element line buried deep within a complex background matrix, you prioritize resolution and integration time. If you are tracking a very fast chemical reaction, you must accept lower resolution to capture data points every millisecond. [8] Understanding this constraint is crucial for interpreting data quality.
The modern spectrometer then converts the measured intensity values into standard digital formats, which can then be manipulated using software to perform calibration, subtraction of background noise (baseline correction), and complex multi-component analysis, which relies on chemometric modeling to deconvolute overlapping spectral signatures from multiple compounds present simultaneously. [8]
The sheer volume of data generated by modern, fast-scanning or array-based systems means the analytical power often shifts from the hardware itself to the sophisticated algorithms used to process the raw intensity values into chemically meaningful results. [8] This integration of advanced optics with computational power defines the contemporary purpose of these instruments: not just to see the light, but to extract hidden quantitative knowledge from its structure.[1]
Related Questions
#Citations
Spectrometer - Wikipedia
Spectrometer - Chemistry LibreTexts
What is a Spectrometer? - Edinburgh Instruments
Spectrometer, Spectroscope, and Spectrograph - SPIE
What is a Spectrometer & its Benefits? - Spectrecology
What is a Spectrometer? Definition, Types, and Uses | Ossila
Spectrometer | Research Starters - EBSCO
What Is a Spectrometer - Definition, Types & Uses - tec5USA
Spectrometer Basics - Laser Lab Source
Understanding Spectrometry and Spectroscopy | ATA Scientific